. 2020 Dec 14;9:e62576. doi: 10.7554/eLife.62576

Figure 21. Downstream targets of MBONs often receive input from more than one MBON.

(A) About 1550 neurons are downstream (including axo-axonal connections) of one or more of the 34 MBON cell types when a threshold of 10 synapses is used. Among them, about 600 are downstream of at least 2 MBON cell types and are therefore capable of integrating information from multiple MBONs. The inset shows an expanded view of the indicated portion of the plot. These neurons include a range of well-characterized neuron types, including MBONs, olfactory projection neurons (PNs), lateral horn neurons (LHNs), and third-order olfactory neurons (TONs; downstream targets of PNs outside the LH, see Schlegel et al., 2020) as well as less characterized neurons (other). Among the neurons that receive input from 10 or more MBON types, LHNs are heavily over-represented. (B-B′) The distribution shown in (A) has been divided into two separate histograms, one showing neurons downstream of multiple typical MBONs, in which atypical MBONs have not been counted (B), and one showing neurons downstream of multiple atypical MBONs, in which typical MBONs have not been counted (B′). The insets show expanded views of the indicated portions of each plot. Atypical MBONs show less convergence than the typical MBONs and do not preferentially converge onto LHNs.

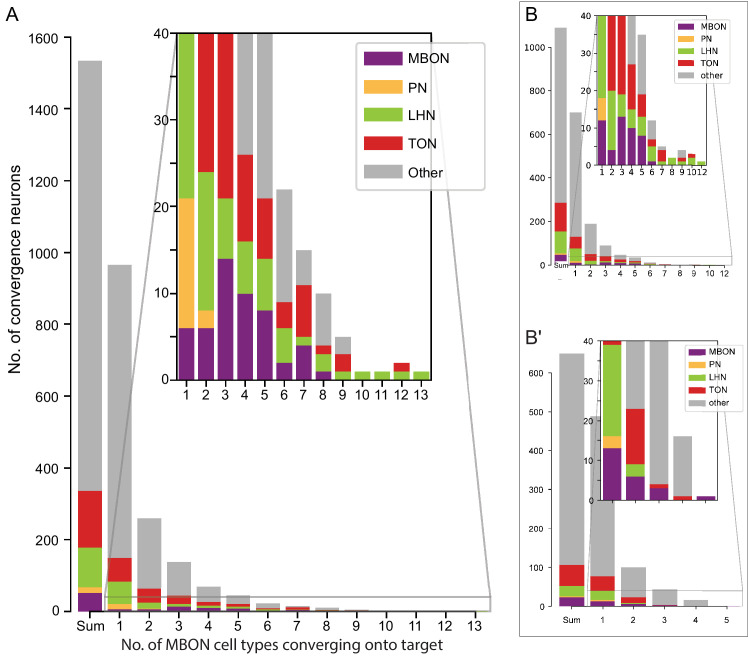
Figure 21.

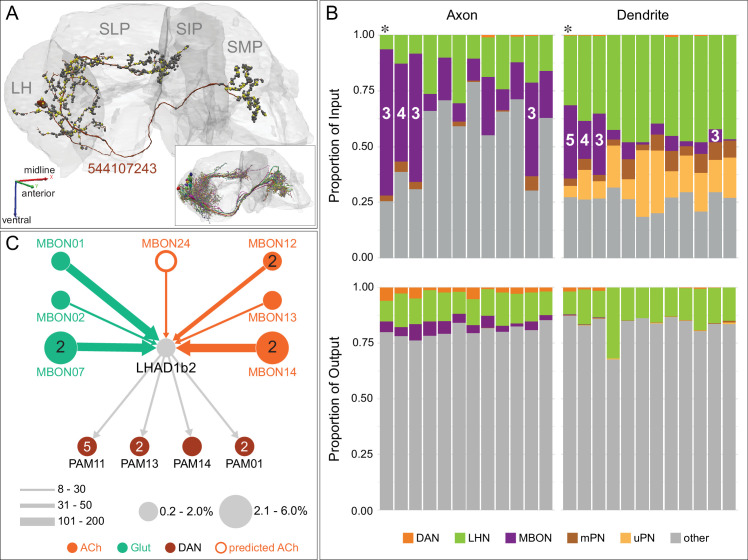
Figure 21—figure supplement 1. A LH neuron downstream of seven MBON types.

Figure 21—figure supplement 1.

The previously reported LH output neuronal type (LHAD1b2; Dolan et al., 2019) acts as a site of integration of innate and learned information. (A) The morphology of a LHAD1b2_d neuron (544107243) is shown in maroon, with its presynaptic and postsynaptic sites represented by yellow and gray dots, respectively. The inset shows the morphologies of all twelve neurons of this cell type: LHAD1b2_a: 673426956 and 544107335; LHAD1b2_b: 5813022459, 573683438 and 483017681; LHAD1b2_c: 5813052205, 543321179, and 574040939; LHAD1b2_d: 544107243 and 730562988; LHAD1c1 : 729867599; and LHAD1c2 : 551298257. (B) Histograms of the proportion of inputs to (top) and outputs from (bottom) each of the twelve LHAD1 neurons from various classes of cells are shown, color-coded. These connections are divided into two groups based on the positions on the neurons’ arbors where they occur, labeled as Axon and Dendrite, based on the distribution of pre- and postsynaptic sites although all its arbors are mixed; the neuron order is the same in all histograms. The number of different MBON types innervating individual LHAD1 neurons varies; the number of MBON types providing input is indicated for those receiving input from three or more types. The neuron (544107243) shown in (A) and (C) is marked with an asterisk. (C) A connectivity diagram of the LHAD1b2_d neuron displayed in (A) is shown. This neuron receives input from seven MBON types and its downstream targets include four DAN cell types. The transmitters used by the MBONs are color-coded, the thickness of the arrows reflects synapse number, and the sizes of the circles that represent the MBONs reflects the percentage of their output directed to this LHAD1b2_d cell. The size of the circle representing LHAD1b2_d indicates the proportion of its total input that is derived from MBONs and the size of the circles representing the DANs indicate the fraction of their input provided by the LHAD1b2_d cell.
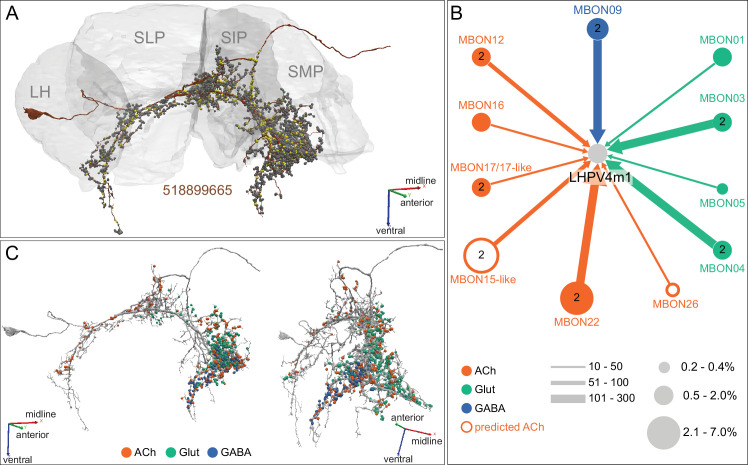
Figure 21—figure supplement 2. A neuron downstream of 11 MBON types.

Figure 21—figure supplement 2.

This neuron LHPV4m1 (518899665) provides an extreme example of a neuron that integrates input from different MBON cell types. (A) The morphology of the neuron is shown in maroon, with its presynaptic and postsynaptic sites represented by yellow and gray dots, respectively. (B) Diagram showing the strengths of input from 11 different MBONs. The transmitters used by the MBONs are color-coded, the thickness of the arrows reflects synapse number, and the sizes of the circles that represent the MBONs reflect the percentage of their output directed to this neuron. (C) Distribution of sites of MBON input to the neuron, color-coded by MBON neurotransmitter type. Note that connections from MBONs with different neurotransmitters are segregated along the neuron’s different arbors; for example, cholinergic inputs are concentrated in its posterior branches.