. 2020 Dec 14;9:e62576. doi: 10.7554/eLife.62576

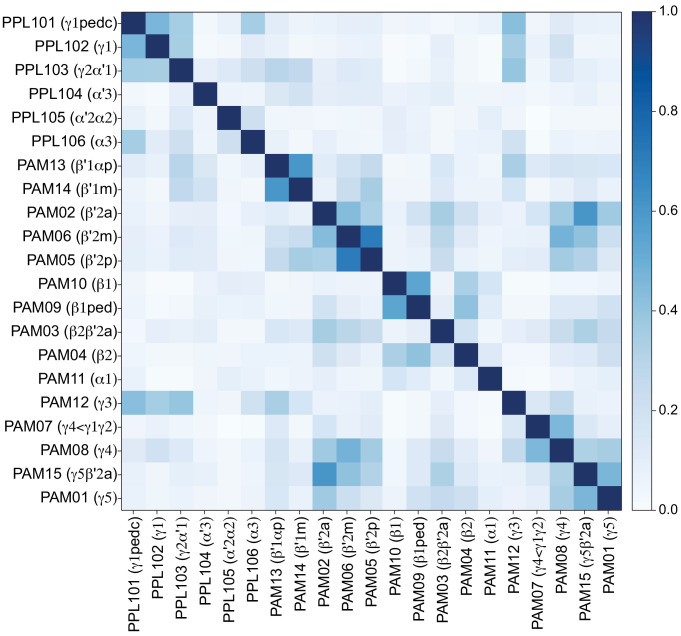
Figure 27. Similarity of input to individual DANs.

Heatmap representing the similarity of inputs received by DANs. Each square represents the cosine similarity of inputs received by each PAM or PPL1 DAN. In order to focus on inputs received outside the lobes of the MB, inputs from KCs, other DANs, APL, and DPM neurons have been excluded. DANs are grouped by type, and the ordering within each type is determined by spectral clustering. Colors on the diagonal indicate whether the given DAN receives feedback from MBONs in the same compartment (yellow), MBONs from different compartments (purple), both (green), or neither (dark blue) as defined in Figure 26. Figure 27—figure supplement 1 shows an expanded view of the PPL1 DAN portion of the heatmap. Figure 27—figure supplement 2 shows the average input similarity between DAN cell types computed after pooling the data for all cells of a given DAN cell type.

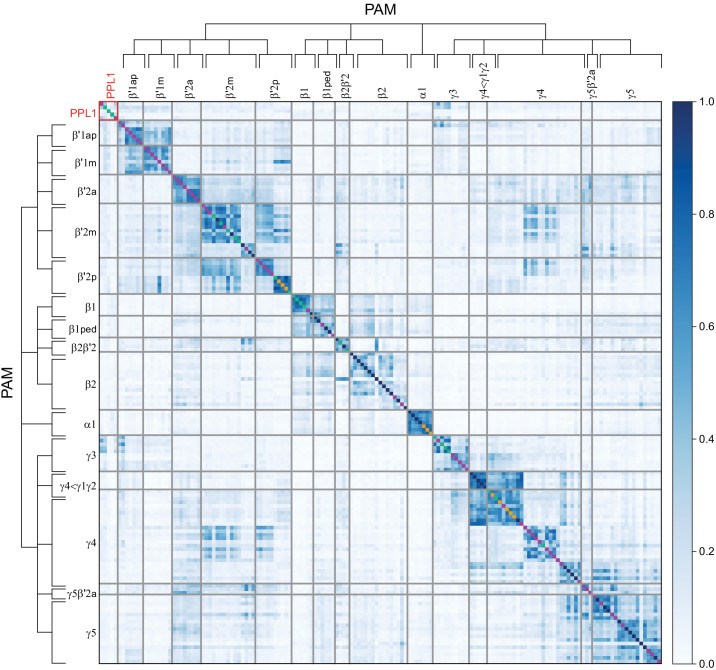
Figure 27.

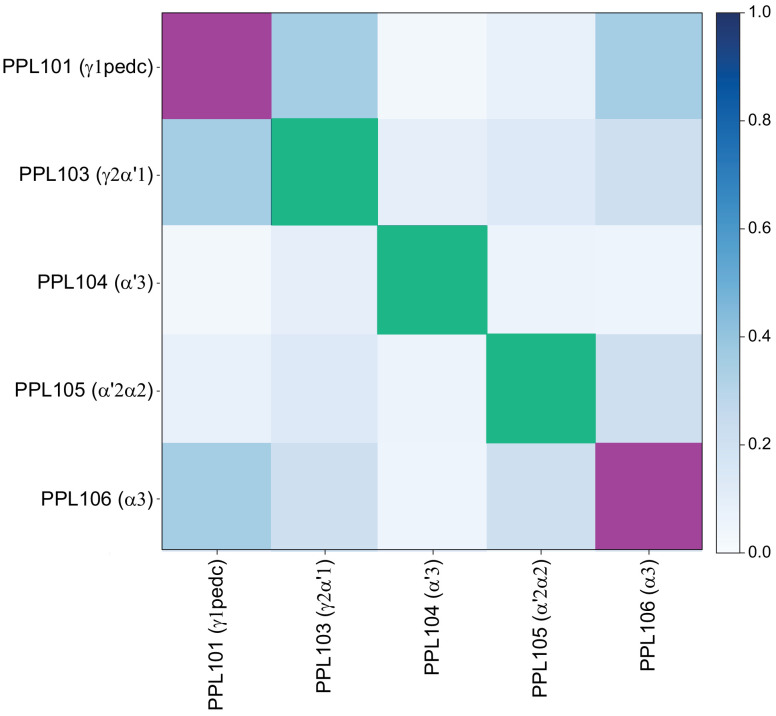
Figure 27—figure supplement 1. Similarity of inputs to PPL1 DANs.

Figure 27—figure supplement 1.

Expanded view of Figure 27 for PPL1 DANs (red square in Figure 27). Note that each PPL1 DAN receives direct feedback from MBONs. Colors on the diagonal indicate whether the given DAN receives feedback from MBONs in a different compartment (purple) or from both the same and different compartments (green).
Figure 27—figure supplement 2. Similarity of inputs to DAN cell types.

Figure 27—figure supplement 2.

Average input similarity between DAN cell types computed after pooling the data for all cells of a given type, as compared to Figure 27 where each individual DAN is plotted separately.
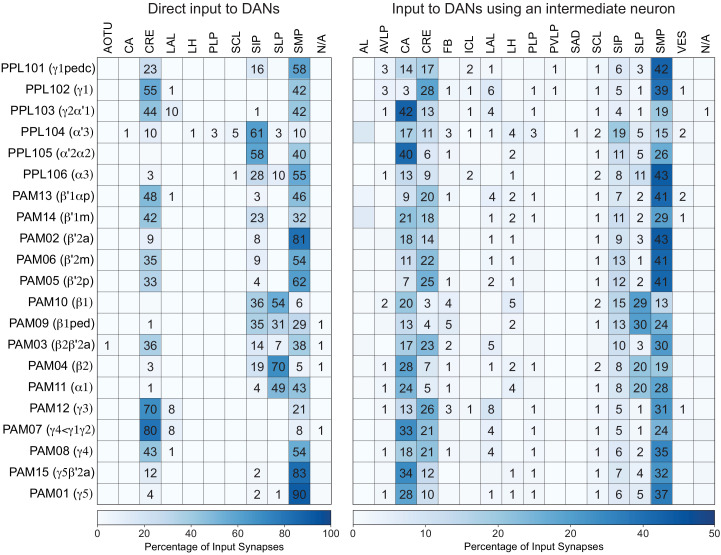
Figure 27—figure supplement 3. DAN input distribution by brain region.

Figure 27—figure supplement 3.

(Left) The value in each box indicates the percentage of the given DAN type’s input synapses that lie in the given brain region. Blank boxes indicate values of less than 1%. (Right) Distribution of brain regions providing input to DAN types using an intermediate interneuron. The value in each box indicates the effective input to the given DAN from the given brain region, mediated by one interneuron. Effective input is a measure that takes into account both the strength of the connection of each of the neurons that provide input to the DAN and the connection strength of other neurons to each of those input interneurons in each brain region. Effective input is computed by matrix-multiplying the inputs to the DANs and the inputs to those DAN-presynaptic neurons (normalizing both matrices so that inputs to all neurons sum to 1). Blank boxes indicate values of less than 1%. The two distributions are generally similar, but there are some clear differences. For example, direct input from CA is minimal but very prominent in input mediated by an interneuron; for example, the γ2α'1 PPL103 DAN receives over 40% of its indirect input from the CA.
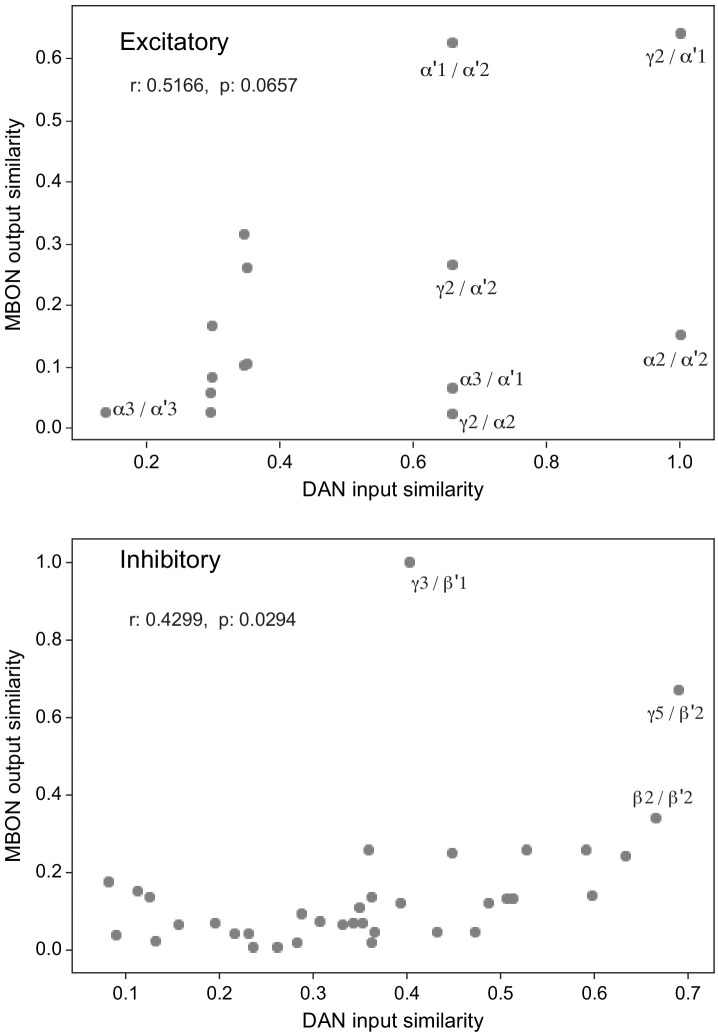
Figure 27—figure supplement 4. Comparing DAN inputs and MBON outputs reveals credit assignment by DANs.

Figure 27—figure supplement 4.

Scatter plot of DAN input similarity (data from Figure 27) and MBON output similarity (data from Figure 16, collapsed by compartment). Each point represents a pair of compartments; notable pairs are labeled in the figure. DAN input similarity is defined as the cosine similarity of the inputs to the DANs of two compartments. MBON output similarly measures the cosine similarity of the outputs from the MBONs in those compartments. The relationship between the two similarity measures indicates that compartments whose MBONs project to similar downstream targets have DANs that receive similar inputs. This structure suggests a form of ‘credit assignment’ in which compartments whose MBONs control similar behaviors also receive similar reinforcement signals. Results are shown for compartments whose MBONs express excitatory (top, ACh) or putatively inhibitory (bottom, GABA, and Glu) neurotransmitters.