. 2020 Dec 14;9:e62576. doi: 10.7554/eLife.62576

Figure 30. Different subtypes of the PAM01, PAM12, and PAM11 DANs synapse onto specific subpopulations of KCs and MBONs within their compartment.

KCs are subtyped as shown in Figure 4—figure supplements 1, 2 and 4. The axons from certain subtypes of DAN occupy different regions of, and together tile, a MB compartment. This permits for specific connectivity to KCs and MBONs within the compartment. A zonal subcompartment arrangement is a feature of many MB compartments and is illustrated here by the distinct morphologies of two subtypes of the γ5 compartment DANs (A, B, D, E). Implications for connectivity of this type of restricted DAN arborization are summarized for the γ5, γ3, and α1 compartments in panel C. Figure 30—figure supplements 2 and 3 show connectivity matrices for additional compartments in the right hemisphere. (A) The axons from PAM01-nc (magenta) overlap with dendrites of MBON27 (γ5d; dark blue). Note that the axons of the two PAM01-nc DANs (magenta) are confined to the dorsal and lateral region of the γ5 compartment (see also Figure 28—figure supplement 1C). (B) PAM01-fb (black) axons do not overlap with the dendrites of MBON27 (dark blue). (C) Schematic of the innervation of subtypes of γ5, γ3, and α1 DANs within the compartment showing their connection to MBONs (left) and KCs (right). Boxes for DAN subtypes and connectivity edges are colored according to subtype identity. Boxes around MBON types are colored by their strongest DAN subtype input. The boxes around KC names are colored to reflect their strongest DAN subtype input in each compartment (the two halves for KCγ types reflect their projections through the γ3 and γ5 compartments). Horizontal bars along the lower edge of the MBON and KC boxes are histograms, with bar colors corresponding to DAN subtypes, representing the proportion of each DAN subtype providing input to the respective MBON or KC subtype. For the KCγ types, the upper bar represents inputs in γ5 and the lower bar in γ3. Typical MBON names in black and atypical MBONs are in blue. Asterisks denote DAN subtypes receiving MBON feedback (compare with Figures 2628). Only cases where a DAN provides at least 0.1% of the MBON’s synaptic input or at least 1% of a KC type’s input from DANs are shown. KC cell types are biased in their representation of different sensory modalities (Figure 15—figure supplement 2). Note that the synapses onto the feedforward MBON06 (β1>α) are likely axo-axonal. (D) The axons from PAM01-nc (magenta) also overlap with the axonal processes of KCγd (yellow). (E) Axons from PAM01-fb (black) do not overlap with the axonal processes of KCγd (yellow).

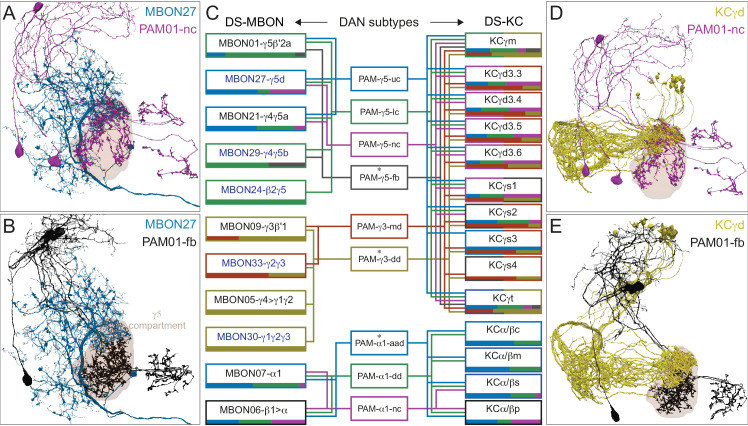
Figure 30.

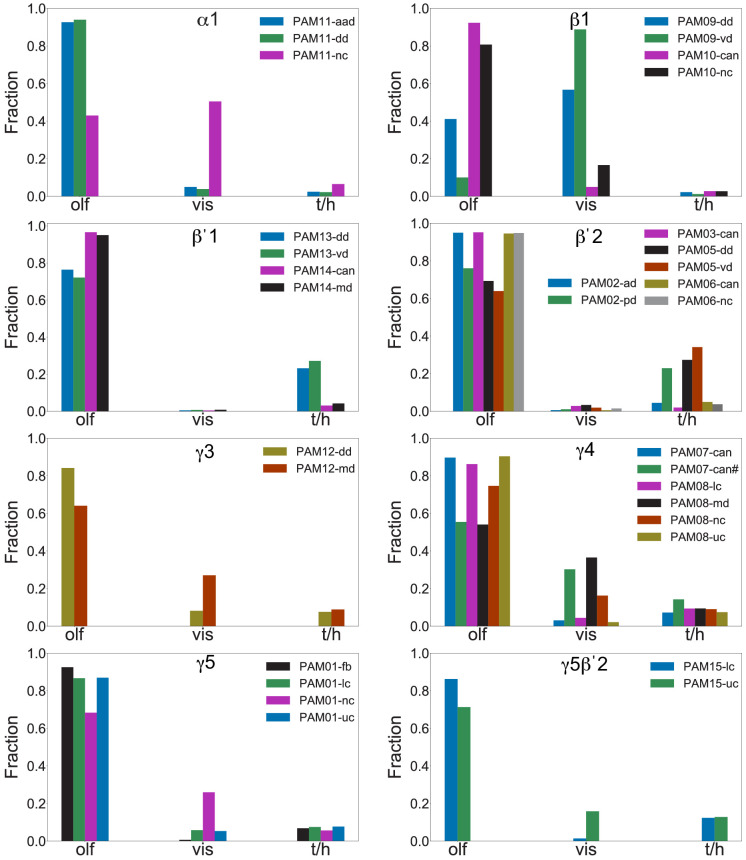
Figure 30—figure supplement 1. DAN subtypes within a compartment can be biased toward KC types representing different sensory modalities.

Figure 30—figure supplement 1.

These plots reveal that in many cases, selective innervation of KC subclasses by particular DAN subtypes within a compartment is organized according to the sensory modality represented by those KCs. Sensory modalities of KCs are assigned according to their PN inputs (derived from the same data as Figure 15—figure supplement 2A). In the indicated compartments, the DANs of a given type are divided into subtypes following criteria from Figure 28. For the PAM07-can (γ4<γ1γ2) subtype, one outlier, indicated by the # sign, which was not apparent with clustering either by morphology or input connectivity, was identified by spectral clustering of DAN-KC connectivity (Figure 29). The y-axis values indicate the fraction of each of the indicated DAN cluster’s output it provides to KCs representing three different sensory modalities. The contributions of each KC to this value are weighted by the number of input synapses they receive from DANs of the given type. Olf - olfactory, vis - visual, and t/h - thermo/hygrosensory.
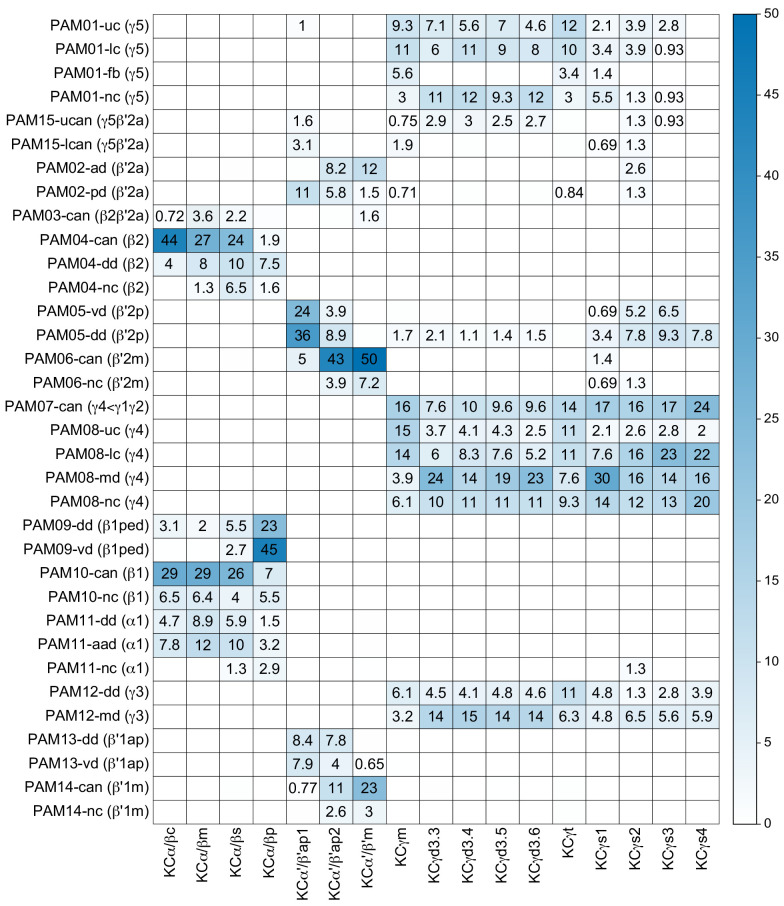
Figure 30—figure supplement 2. Within a compartment PAM DAN subtypes synapse onto specific KC subtypes as defined by the clustering shown in Figure 4—figure supplements 1, 2 and 4.

Figure 30—figure supplement 2.

DAN to KC connectivity matrix underlying Figure 30. DAN subtypes, defined by morphological and upstream connectivity clustering (see Figure 28), synapse onto specific types of KCs within a compartment. Each cell of the matrix shows the percentage of inputs provided by a particular DAN subtype, normalized by all DAN inputs to that KC type. DAN subtypes that have axons confined to portions of the same compartment often differ in their KC connectivity. Only connections constituting greater than 0.5% of the KC’s total DAN input in the compartment are shown.
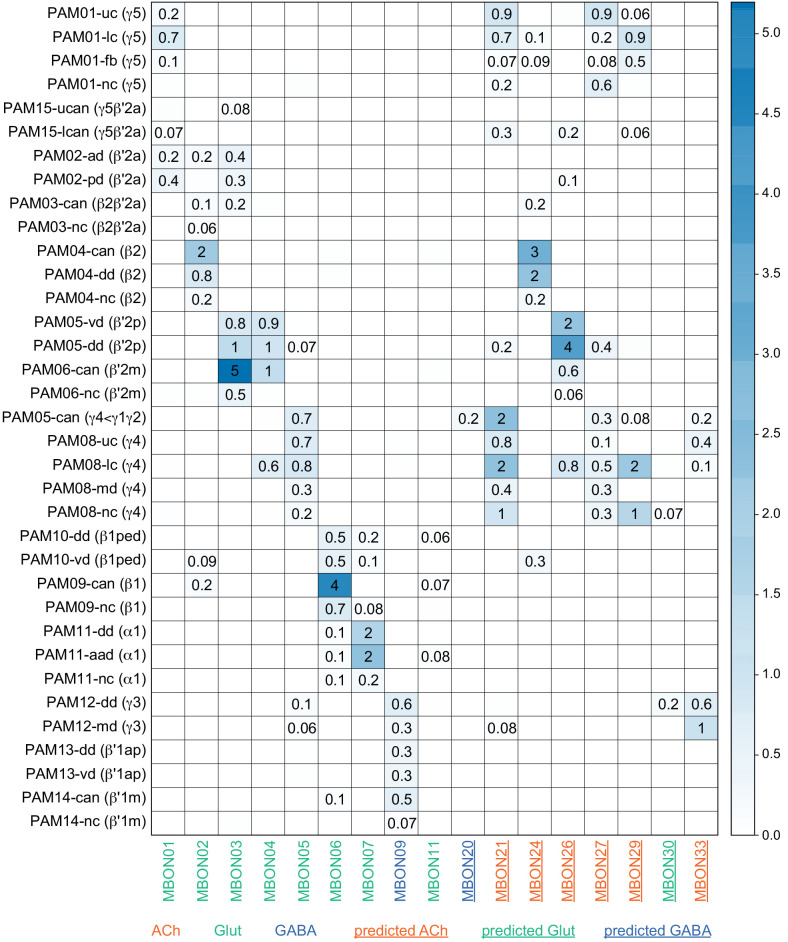
Figure 30—figure supplement 3. PAM DAN subtypes synapse selectively onto particular MBONs within a compartment.

Figure 30—figure supplement 3.

DAN to MBON connectivity matrix underlying Figure 30. DAN subtypes as defined by morphological and upstream connectivity clustering (from Figure 28) connect to specific MBONs within the respective compartment. Each cell of the matrix shows the percentage of input provided by the indicated DAN subtype, normalized by the MBON’s synaptic input. DAN subtypes that have axons confined to a specific portion of the same compartment often differ in their connectivity to MBONs. Only connections constituting greater than 0.1% of the synaptic input to each MBON are shown.