. 2020 Dec 14;9:e62576. doi: 10.7554/eLife.62576

Figure 8. Atypical MBONs.

Each panel shows one of the 14 types of atypical MBONs, with its name, the compartment(s) it innervates and the number of cells of that type per brain hemisphere indicated. Figure 6—figure supplement 1 shows which DANs, MBONs, and KCs are found in each compartment. MB lobes are shown in gray and in the bottom right panel the lateral accessory lobe (LAL) and vest (VES) brain areas are highlighted. Neuronal morphologies are shown with dark gray dots and yellow dots indicating postsynaptic and presynaptic sites, respectively. The MBONs shown in this figure are considered to be atypical in that their dendritic arbors are only partially within the MB lobes. Twelve of these types were discovered in the course of the current study. The other two, the GABAergic MBON10 and MBON20, were described by Aso et al., 2014a, but we have reclassified them here as atypical MBONs because they have dendrites both inside and outside the MB lobes. The three MBON10s in the EM volume have 69 , 68, and 50% of their postsynaptic sites outside the MB lobes; one is shown here. All the other atypical MBONs occur once per hemisphere. Unlike most typical MBONs that innervate brain areas that are dorsal to the MB, six of the atypical MBONs innervate areas that are ventral to the MB. The LAL is a target of several atypical MBONs, and one also innervates the VES. More detailed information about each of the atypical MBONs can be found in Figure 8—figure supplements 114 and Figure 8—videos 114. Figure 8—figure supplement 15 compares the non-MB inputs to these MBONs. The bounding box for each MBON is color-coded by the neurotransmitter used by that MBON; dashed boxes are used where the transmitter type is based on computational prediction (see Figure 6—figure supplement 2). Links to the neuPrint records of these MBON types are as follows: MBON10, MBON20, MBON24, MBON25, MBON26, MBON27, MBON28, MBON29, MBON30, MBON31, MBON32, MBON33, MBON34, and MBON35.

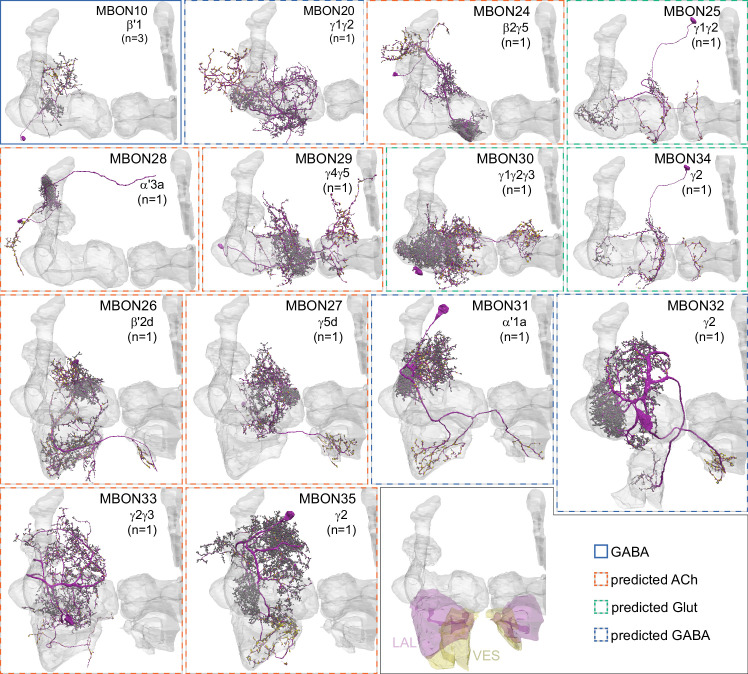
Figure 8.

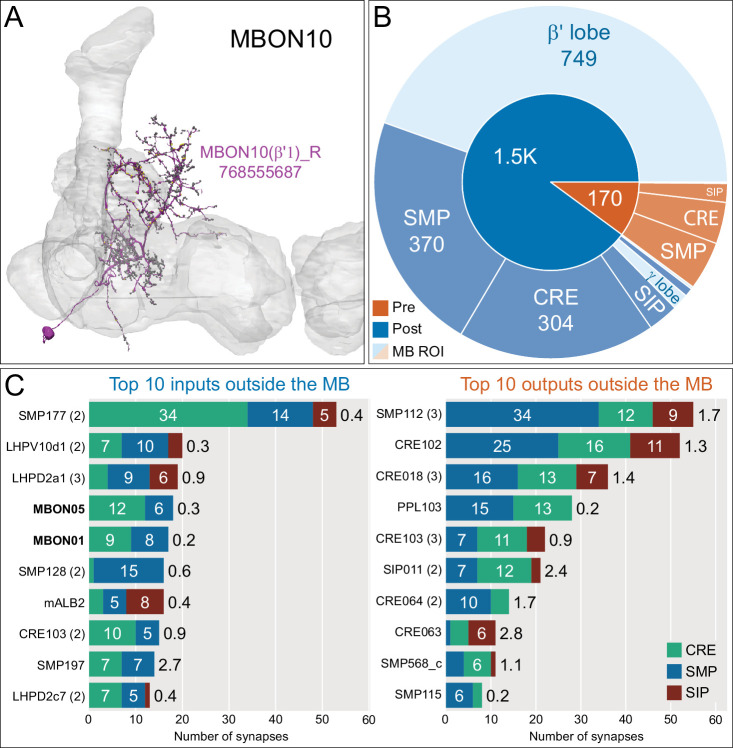
Figure 8—figure supplement 1. Atypical MBON10.

Figure 8—figure supplement 1.

(A) Atypical MBON10 is the only atypical MBON cell type with more than one cell per brain hemisphere. One of the three MBON10s is shown here; all three cells are shown in Figure 8—video 1. Presynaptic sites are shown in yellow and postsynaptic sites are shown in gray. (B) A pie chart showing the distribution of MBON10’s presynaptic sites (indicated in orange) and postsynaptic sites (in blue). The inner circle shows the total number of MBON10’s pre- and postsynaptic sites; the numbers represent the MBON10 shown in A. The outer circle of the pie chart shows the brain regions in which these sites occur; regions of the MB are shown in lighter colors. (C) MBON10’s top 10 inputs (left) and outputs (right) outside the MB lobes are shown by neuron type as bar charts. The numbers in each row represent synapse numbers and the brain regions in which these synapses occur are color- coded. (Left) T he numbers next to each row indicate the percentage of that neuron’s synaptic output that goes to MBON10. Note that two typical MBONs synapse onto MBON10, MBON01 (γ5β'2a), and MBON05 (γ4>γ1γ2). Links to these cell types in neuPrint are: SMP177, LHPV10d1, LHPD2a1, MBON05, MBON01, mALB2, SMP128, CRE103, SMP197, and LHPD2c7. (Right) T he numbers next to each row indicate the fraction of that neuron's input that is provided by MBON10. Links to these cell types in neuPrint are: SMP112, CRE102, CRE018, PPL103, CRE103, SIP011, CRE064, SMP568_c, CRE063, and SMP115.
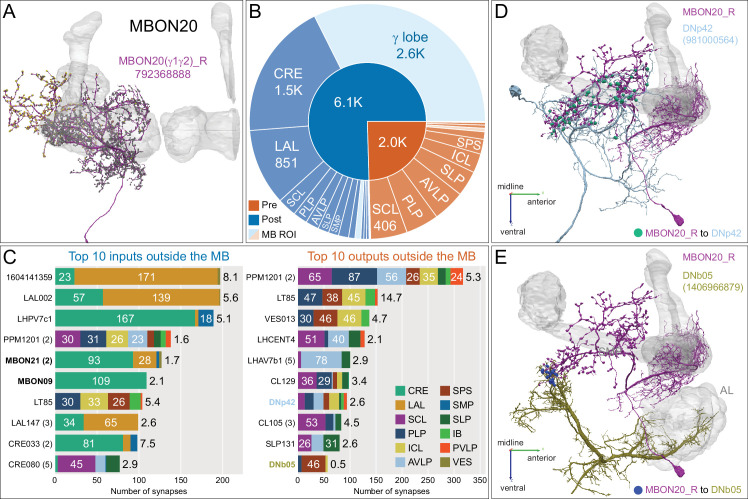
Figure 8—figure supplement 2. Atypical MBON20.

Figure 8—figure supplement 2.

(A) Atypical MBON20 (γ1γ2) is shown here and in Figure 8—video 2. Presynaptic sites are shown in yellow and postsynaptic sites are shown in gray. MBON20 receives 45% of its input from sites within MB lobes and 85% of those input are in the γ1γ2 compartments. (B) A pie chart showing the distribution of MBON20’s presynaptic sites (indicated in orange) and postsynaptic sites (in blue). The inner circle shows the total number of MBON20’s pre- and postsynaptic sites. The outer circle of the pie chart shows the brain regions in which these sites occur; regions of the MB are shown in lighter colors. (C) MBON20’s top 10 inputs (left) and outputs (right) outside the MB lobes are shown by neuron type as bar charts. The numbers in each row represent synapse numbers and the brain regions in which these synapses occur are color- coded. (Left) T he numbers next to each row indicate the percentage of that neuron’s synaptic output that goes to MBON20. Links to these cell types in neuPrint are: 1604141359, LAL002, LHPV7c1, PPM1201, MBON21, MBON09, LT85, LAL147, CRE033, and CRE080. (Right) T he numbers next to each row indicate the fraction of that neuron's input that is provided by MBON20. Links to these cell types in neuPrint are: PPM1201, LT85, VES013, LHCENT4, LHAV7b1, CL129, DNp42, CL105, SLP131, and DNb05. Neuron names in colored text indicate neurons further discussed in panel D and E and are color-coded to match the neurons in these panels. Note MBON20 makes strong reciprocal connections with LT85, which is a LO tangential neuron conveying visual information, and PPM1201. (D, E) Although not all DNs have been identified, there are at least two individual DNs that are strongly connected to MBON20. (D) DNp42, connects to MBON20 with 94 synapses in dorsal brain regions, including SCL and PLP. (E) DNb05, connects to MBON20 with 57 synapses in SPS. Note DNb05 also receives input from PNs in the AL.
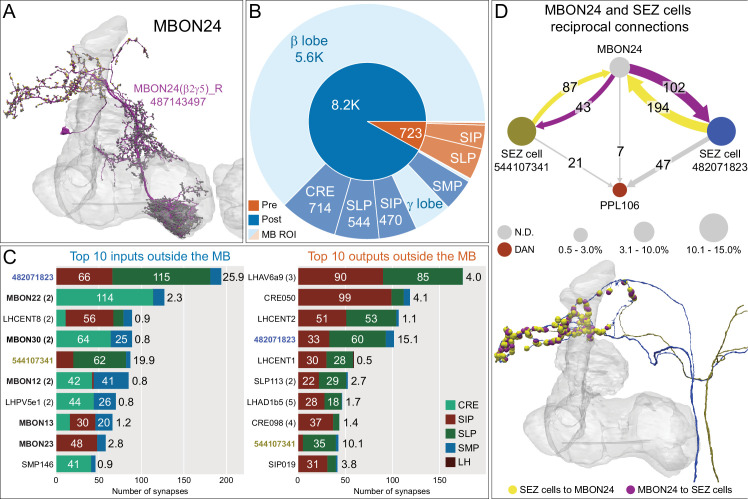
Figure 8—figure supplement 3. Atypical MBON24.

Figure 8—figure supplement 3.

(A) Atypical MBON24 (β2γ5) is shown here and in Figure 8—video 3. Presynaptic sites are shown in yellow and postsynaptic sites are shown in gray. MBON24 receives 75% of its inputs from sites within the MB lobes and 90% of these inputs are in the β2 compartment. (B) A pie chart showing the distribution of MBON24’s presynaptic sites (indicated in orange) and postsynaptic sites (in blue). The inner circle shows the total number of MBON24’s pre- and postsynaptic sites. The outer circle of the pie chart shows the brain regions in which these sites occur; regions of the MB are shown in lighter colors. (C) MBON24’s top 10 inputs (left) and outputs (right) outside the MB lobes are shown by neuron type as bar charts. The numbers in each row represent synapse numbers and the brain regions in which these synapses occur are color-coded. (Left) T he numbers next to each row indicate the percentage of that neuron’s synaptic output that goes to MBON24. Links to these cell types in neuPrint are: 482071823, MBON22, LHCENT8, MBON30, 544107341, MBON12, LHPV5e1, MBON13, MBON23, and SMP146. Note that four of MBON24’s top input neurons are typical MBONs (indicated by bold text). (Right) T he numbers next to each row indicate the fraction of that neuron's input that is provided by MBON24. Links to these cell types in neuPrint are: LHAV6a9, CRE050, LHCENT2, 482071823, LHCENT1, SLP113, LHAD1b5, CRE098, 544107341, and SIP019. Neuron names in colored text indicate neurons further discussed in panel D and are color-coded to match the diagrams in panel D. (D) Two of the top inputs to MBON24, and MBON24’s reciprocal connections back to them, are shown. These cells send processes outside of the hemibrain volume, presumably to the subesophageal zone (SEZ), as has been confirmed for the more strongly connected of the two (482071823) by reconstructing its counterpart in the FAFB volume (Figure 35C,E). The same two neurons also provide strong input to a PPL106, contributing more than 0.5% of its total input, and are part of cluster 27 of DAN inputs shown in Figure 31. These SEZ cells also receive strong input from MBON14 (387 synapses). The size of the MBON24 circle indicates the percent of its total output (based on synapse number) that goes to PPL106 and SEZ neurons; while the sizes of the circles of the SEZ neurons and PPL106 reflect the percentage of that cell's input that comes from MBON24.
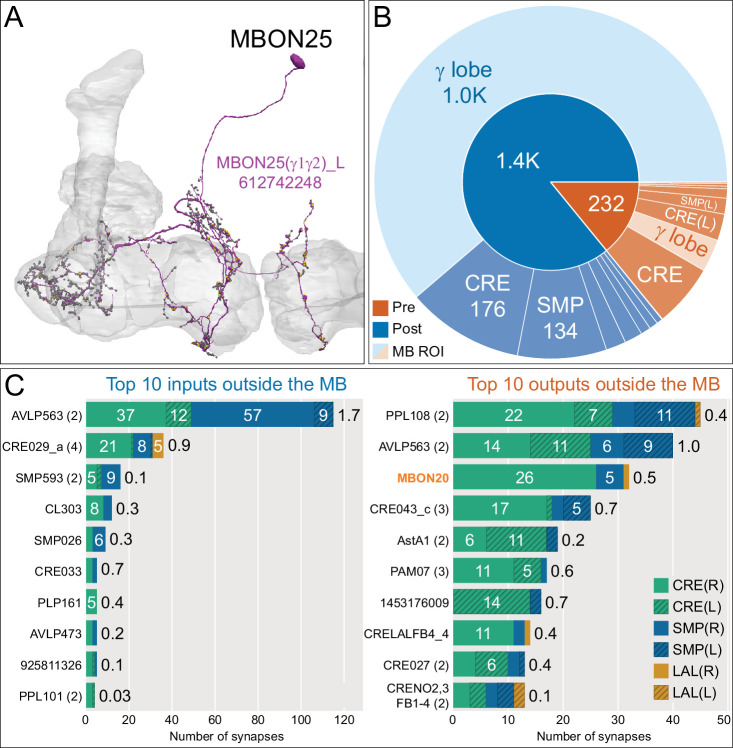
Figure 8—figure supplement 4. Atypical MBON25.

Figure 8—figure supplement 4.

(A) Atypical MBON25 (γ1γ2) is shown here and in Figure 8—video 4. Presynaptic sites are shown in yellow and postsynaptic sites are shown in gray. MBON25 receives input in the γ1 and γ2 compartments. (B) A pie chart showing the distribution of MBON25’s presynaptic sites (indicated in orange) and postsynaptic sites (in blue). The inner circle shows the total number of MBON25’s pre- and postsynaptic sites. The outer circle of the pie chart shows the brain regions in which these sites occur; regions of the MB are shown in lighter colors. The CRE is MBON25’s major output area and MBON25 extends bilaterally to the left hemisphere CRE. (C) MBON25’s top 10 inputs (left) and outputs (right) outside the MB lobes are shown by neuron type as bar charts. The numbers in each row represent synapse numbers and the brain regions in which these synapses occur are color-coded. (Left) T he numbers next to each row indicate the percentage of that neuron’s synaptic output that goes to MBON25. Links to these cell types in neuPrint are: AVLP563, CRE029_a, SMP593, CL303, SMP026, CRE033, PLP161, AVLP473, 925811326, and PPL101. (Right) T he numbers next to each row indicate the fraction of that neurons input that is provided by MBON25. Links to these cell types in neuPrint are: PPL108, AVLP563, MBON20, CRE043_c, AstA1, PAM07, 1453176009, CRELALFB4_4 (FB4H), CRE027, and CRENO2,3FB1-4 (FB1H). MBON25 makes axo-dendritc connections outside the MB onto MBON20 (light orange shading); MBON20 and MBON25 both innervate the γ1 and γ2 compartments.
Figure 8—figure supplement 5. Atypical MBON26.

Figure 8—figure supplement 5.

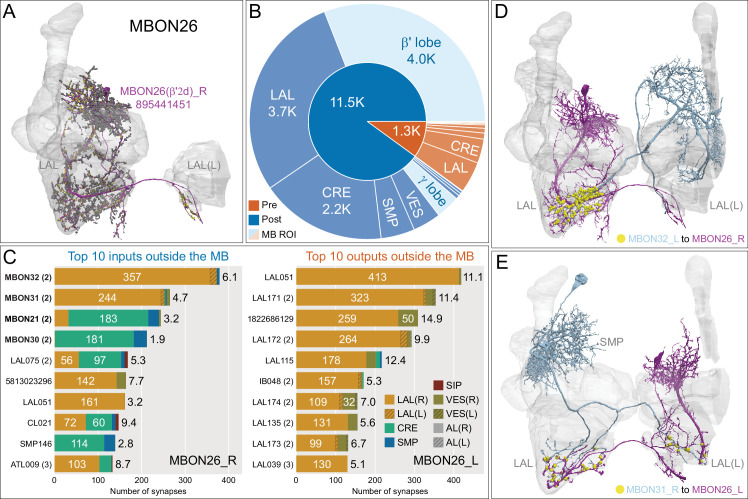
(A) Atypical MBON26 (β′2d) is shown here and in Figure 8—video 5. Presynaptic sites are shown in yellow and postsynaptic sites are shown in gray. MBON26 receives input from the β′2 compartment. (B) A pie chart showing the distribution of MBON26’s presynaptic sites (indicated in orange) and postsynaptic sites (in blue). The inner circle shows the total number of MBON26’s pre- and postsynaptic sites. The outer circle of the pie chart shows the brain regions in which these sites occur; regions of the MB are shown in lighter colors. Note MBON26_R’s output in LAL(L) is incomplete due to the left LAL(L) being only partially contained within the hemibrain volume (see panel D); to display in the output pie chart what we believe to be MBON26’s full output in both LALs we combined the output of MBON26_L in LAL(R) with that of MBON26_R in LAL(R). (C) MBON26’s top 10 inputs (left) and outputs (right) outside the MB lobes are shown by neuron type as bar charts. The numbers in each row represent synapse numbers and the brain regions in which these synapses occur are color-coded. (Left) The numbers next to each row indicate the percentage of that neuron’s synaptic output that goes to MBON26. Links to these cell types in neuPrint are: MBON32, MBON31, MBON21, MBON30, LAL075, 5813023296, LAL051, CL021, SMP146, and ATL009. (Right) T he numbers next to each row indicate the fraction of that neurons input that is provided by MBON26. Links to these cell types in neuPrint are: LAL051, LAL171, 1822686129, LAL172, LAL115, IB048, LAL174, LAL135, LAL173, and LAL039. Note that MBON26’s strongest inputs come from MBON21 (γ4γ5) and three atypical MBONs, MBON30 (γ1γ2γ3), MBON31 (α′1) and MBON32 (γ2). MBON26 is at the top layer of an MBON feedforward hierarchy network and also gets strong input from MBON27 (γ5d) and MBON29 (γ4γ5) (Figure 24). (D,E) The connections from MBON31 and MBON32 to MBON26 occur almost exclusively in the LAL.
Figure 8—figure supplement 6. Atypical MBON27.

Figure 8—figure supplement 6.

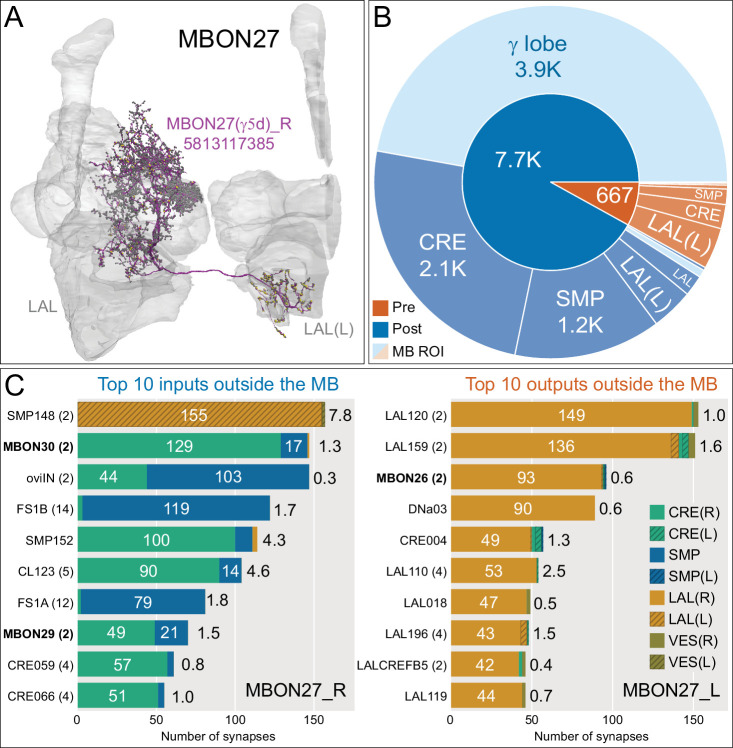
(A) Atypical MBON27 (γ5d) is shown here and in Figure 8—video 6. Presynaptic sites are shown in yellow and postsynaptic sites are shown in gray. MBON27 receives about half its input inside the MB, from the γ5 compartment, and outputs to both the ipsi- and contralateral LALs. (B) A pie chart showing the distribution of MBON27’s presynaptic sites (indicated in orange) and postsynaptic sites (in blue). The inner circle shows the total number of MBON27’s pre- and postsynaptic sites. The outer circle of the pie chart shows the brain regions in which these sites occur; regions of the MB are shown in lighter colors. The LAL is MBON27’s major output area. (C) MBON27’s top 10 inputs (left) and outputs (right) outside the MB lobes are shown by neuron type as bar charts. The numbers in each row represent synapse numbers and the brain regions in which these synapses occur are color-coded. (Left) T he numbers next to each row indicate the percentage of that neuron’s synaptic output that goes to MBON27. Links to these cell types in neuPrint are: SMP148, MBON30, oviIN, FS1B, SMP152, CL123, FS1A, MBON29, CRE059, and CRE066. (Right) the numbers next to each row indicate the fraction of that neurons input that is provided by MBON27. Links to these cell types in neuPrint are: LAL120, LAL159, MBON26, DNa03, CRE004, LAL110, LAL018, LAL196, LALCREFB5 (FB5A), and LAL119. Note that MBON27 receives input from two atypical MBONs, MBON29 (γ4γ5), and MBON30 (γ1γ2γ3), and outputs onto another atypical MBON, MBON26 (β′2d).
Figure 8—figure supplement 7. Atypical MBON28.

Figure 8—figure supplement 7.

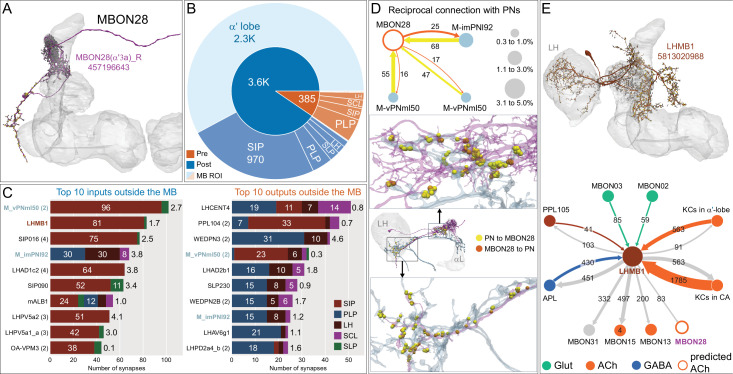
(A) Atypical MBON28 (α′3) is shown here and in Figure 8—video 7. Presynaptic sites are shown in yellow and postsynaptic sites are shown in gray. MBON28 receives about 60% of its input from the α′3 compartment within the MB lobes; within the α′3 compartment its arbors have a similar morphology to those of MBON16, but MBON28’s dendrites also extend outside the MB lobe. (B) A pie chart showing the distribution of MBON28’s presynaptic sites (indicated in orange) and postsynaptic sites (in blue). The inner circle shows the total number of MBON28’s pre- and postsynaptic sites. The outer circle of the pie chart shows the brain regions in which these sites occur; regions of the MB are shown in lighter colors. (C) MBON28’s top 10 inputs (left) and outputs (right) outside the MB lobes are shown by neuron type as bar charts. The numbers in each row represent synapse numbers and the brain regions in which these synapses occur are color-coded. (Left) T he numbers next to each row indicate the percentage of that neuron’s synaptic output that goes to MBON28. Links to these cell types in neuPrint are: M_vPNml50, LHMB1, SIP016, M_imPNl92, LHAD1c2, SIP090, mALB1, LHPV5a2, LHPV5a1_a, and OA-VPM3. (Right) T he numbers next to each row indicate the fraction of that neurons input that is provided by MBON28. Links to these cell types in neuPrint are: LHCENT4, PPL104, WEDPN3, M_vPNml50, LHAD2b1, SLP230, WEDPN2B, M_imPNl92, LHAV6g1, and LHPD2a4_b. Neurons with names in bold text are color-coded to match the diagrams in panel D. (D) MBON28 makes strong reciprocal connections with three inhibitory multi-glomerular PNs. The size of the circle representing the PN indicates the percentage of that PN’s output that goes to MBON28. The size of the MBON28 circle represents the percentage of its inputs outside the MB provided by the three PNs. This is the only MBON that receives PN input among its top 10 inputs. These reciprocal connections are distributed in two major areas: one near the MB, the other near or inside the LH. (E) Top: MBON28’s second strongest input neuron, LHMB1, is shown here and in Figure 8—video 7; LHMB1 innervates both the LH, the CA and the α lobe. Bottom: Connectivity diagram showing LHMB1’s main outputs and inputs. LHMB1 makes synapses onto MBONs on their dendrites inside the lobes as well as outside the MB through axo-axonal connections, and receives input from MBON02 (β2β′2a) and MBON03 (β′2mp), and reciprocally connects to APL and KCs in both the α lobe and CA.
Figure 8—figure supplement 8. Atypical MBON29.

Figure 8—figure supplement 8.

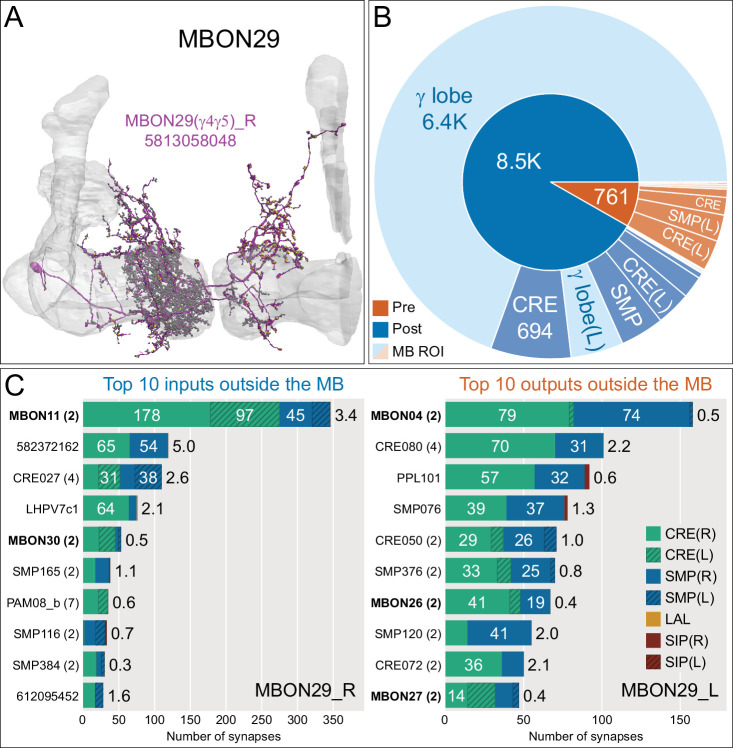
(A) Atypical MBON29 (γ4γ5) is shown here and in Figure 8—video 8. Presynaptic sites are shown in yellow and postsynaptic sites are shown in gray. MBON29 receives about 80% of its input from the γ4 and γ5 compartments within the MB lobes. (B) A pie chart showing the distribution of MBON29’s presynaptic sites (indicated in orange) and postsynaptic sites (in blue). The inner circle shows the total number of MBON29’s pre- and postsynaptic sites. The outer circle of the pie chart shows the brain regions in which these sites occur; regions of the MB are shown in lighter colors. (C) MBON29’s top 10 inputs (left) and outputs (right) outside the MB lobes are shown by neuron type as bar charts. The numbers in each row represent synapse numbers and the brain regions in which these synapses occur are color-coded. (Left) T he numbers next to each row indicate the percentage of that neuron’s synaptic output that goes to MBON29. Links to these cell types in neuPrint are: MBON11, 582372162, CRE027, LHPV7c1, MBON30, SMP165, PAM08_b, SMP116, SMP384, and 612095452 (Right) T he numbers next to each row indicate the fraction of that neuron's input that is provided by MBON29. Links to these cell types in neuPrint are: MBON04, CRE080, PPL101, SMP076, SMP376, CRE050, MBON26, SMP120, CRE072, and MBON27. (Note that to ensure completeness of the contralateral arbor, MBON29_L was used.) Note that MBON29 receives very strong input from MBON11 (γ1pedc>α/β)_R and _L, which together contribute 9% of MBON29’s total input outside the MB. MBON28 also receives input from MBON30 (γ1γ2γ3). MBON29 makes axo-axonal synapses onto MBON04 (β′2mp_bilateral) as well as onto atypical MBONs, MBON26 (β′2d), and MBON27 (γ5d).
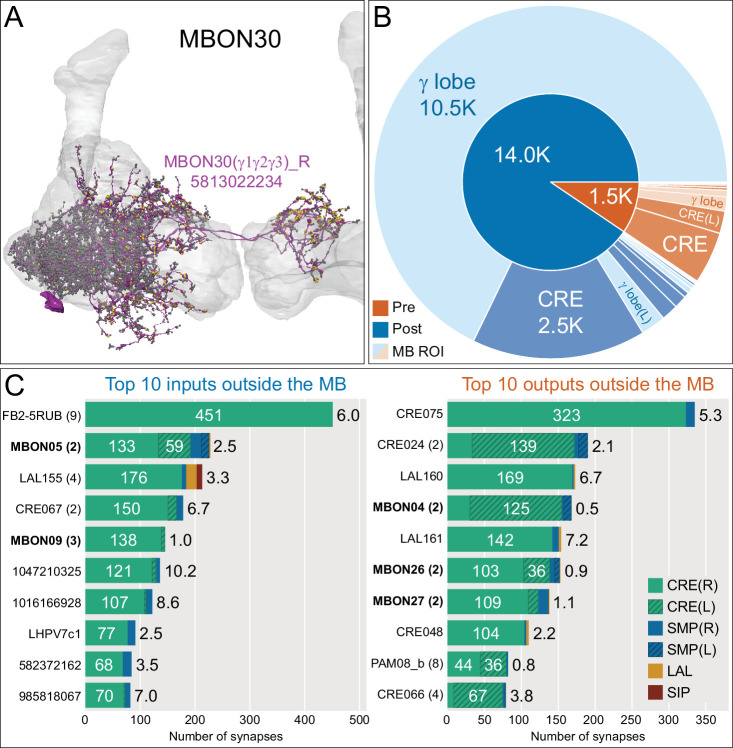
Figure 8—figure supplement 9. Atypical MBON30.

Figure 8—figure supplement 9.

(A) Atypical MBON30 (γ1γ2γ3) is shown here and in Figure 8—video 9. Presynaptic sites are shown in yellow and postsynaptic sites are shown in gray. MBON30 receives about 80% of its input within the MB lobes, primarily from the γ1, γ2, and γ3 compartments. (B) A pie chart showing the distribution of MBON30’s presynaptic sites (indicated in orange) and postsynaptic sites (in blue). The inner circle shows the total number of MBON30’s pre- and postsynaptic sites. The outer circle of the pie chart shows the brain regions in which these sites occur; regions of the MB are shown in lighter colors. The CRE is MBON30’s major output area. (C) MBON30’s top 10 inputs (left) and outputs (right) outside the MB lobes are shown by neuron type as bar charts. The numbers in each row represent synapse numbers and the brain regions in which these synapses occur are color-coded. (Left) T he numbers next to each row indicate the percentage of that neuron’s synaptic output that goes to MBON30. Links to these cell types in neuPrint are: FR1, MBON05, LAL155, CRE067, MBON09, 1047210325, 1016166928, LHPV7c1, 582372162, and 985818067. MBON30 gets strong input from nine fan-shaped body cells of cell type FB2-5RUB (FR1; collectively they make 451 synapses onto MBON30’s arbors in a small brain area called the rubus (see Figure 8—video 9)). (Right) The numbers next to each row indicate the fraction of that neurons input that is provided by MBON30. Links to these cell types in neuPrint are: CRE075, CRE024, LAL160, MBON04, LAL161, MBON26, MBON27, CRE048, PAM08_b, and CRE066. Note that MBON30 receives input from MBON05 (γ4>γ1γ2) and MBON09 (γ3β′1) and makes synapses onto the atypical MBONs MBON27 (γ5d) and MBON28 (α′3) as well as to typical MBON04 (β′2mp_bilateral).
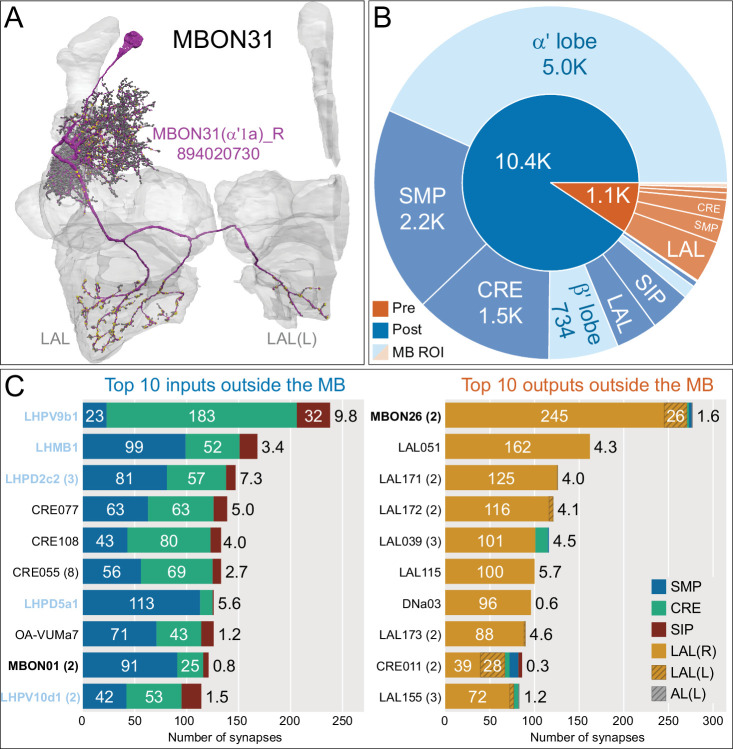
Figure 8—figure supplement 10. Atypical MBON31.

Figure 8—figure supplement 10.

(A) Atypical MBON31 (α′1a) is shown here and in Figure 8—video 10. Presynaptic sites are shown in yellow and postsynaptic sites are shown in gray. MBON31 gets about half of its inputs from the α′1 compartment inside the MB and sends outputs to LAL. (B) A pie chart showing the distribution of MBON31’s presynaptic sites (indicated in orange) and postsynaptic sites (in blue). The inner circle shows the total number of MBON31’s pre- and postsynaptic sites. The outer circle of the pie chart shows the brain regions in which these sites occur; regions of the MB are shown in lighter colors. (C) MBON31’s top 10 inputs (left) and outputs (right) outside the MB lobes are shown by neuron type as bar charts. The numbers in each row represent synapse numbers and the brain regions in which these synapses occur are color-coded. (Left) T he numbers next to each row indicate the percentage of that neuron’s synaptic output that goes to MBON31. Links to these cell types in neuPrint are: LHPV9b1, LHMB1, LHPD2c2, CRE077, CRE108, CRE055, LHPD5a1, OA-VUMa7, MBON01, and LHPV10d1. (Right) The numbers next to each row indicate the fraction of that neurons input that is provided by MBON31. Links to these cell types in neuPrint are: MBON26, LAL051, LAL171, LAL172, LAL039, LAL115, DNa03, LAL173, CRE011, and LAL155. MBON31 top 10 inputs include five cell types that convey information from the LH and MBON01 (γ5β'2a); its strongest downstream target is the atypical MBON, MBON26 (β′2d).
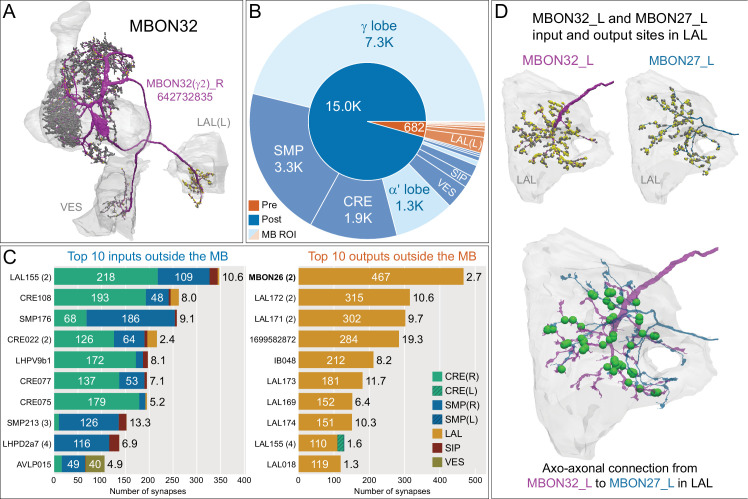
Figure 8—figure supplement 11. Atypical MBON32.

Figure 8—figure supplement 11.

(A) Atypical MBON32 (γ2) is shown here and in Figure 8—video 11. Presynaptic sites are shown in yellow and postsynaptic sites are shown in gray. MBON32 gets about 50% of its synaptic input inside the MB lobes, primarily from the γ2 compartment, and sends about half its output to the contralateral LAL. (B) A pie chart showing the distribution of MBON32’s presynaptic sites (indicated in orange) and postsynaptic sites (in blue). The inner circle shows the total number of MBON32’s pre- and postsynaptic sites. The outer circle of the pie chart shows the brain regions in which these sites occur; regions of the MB are shown in lighter colors. (C) MBON32’s top 10 inputs (left) and outputs (right) outside the MB lobes are shown by neuron type as bar charts. The numbers in each row represent synapse numbers and the brain regions in which these synapses occur are color-coded. (Left) T he numbers next to each row indicate the percentage of that neuron’s synaptic output that goes to MBON32. Links to these cell types in neuPrint are: LAL155, CRE108, SMP176, CRE022, LHPV9b1, CRE077, CRE075, SMP213, LHPD2a7, and AVLP015. MBON32’s axon targets the contralateral LAL and the left brain hemisphere is incomplete in the hemibrain volume; therefore, we used MBON32_L’s arbors in the right hemisphere to ascertain MBON32’s downstream targets. (Right) T he numbers next to each row indicate the fraction of that neuron's input that is provided by MBON32. Links to these cell types in neuPrint are: MBON26, LAL172, LAL171, 1699582872, IB048, LAL173, LAL169, LAL174, LAL155, and LAL018. (D) We use the MBON32_L to illustrate MBON32’s downstream targets in the right hemisphere LAL. MBON27 (γ5d)’s axon also targets contralateral LAL (see Figure 8—figure supplement 6); the arbors of MBON32 and MBON27 in the LAL are shown separately in the upper portion of panel (D) with their pre- (yellow) and postsynaptic (gray) sites indicated. MBON32_L makes axo-axonal synapses onto MBON27_L, indicated by the green dots (lower portion of panel (D)).
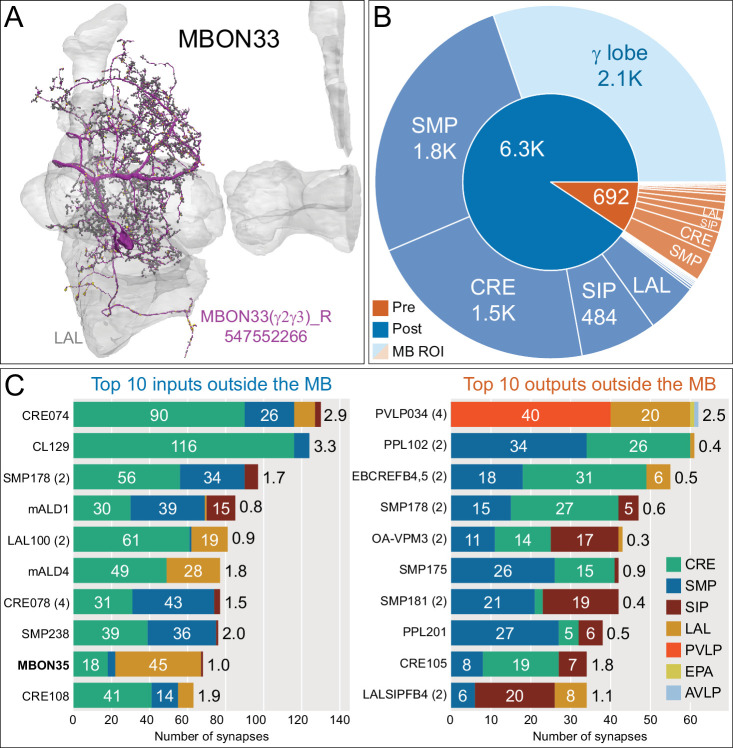
Figure 8—figure supplement 12. Atypical MBON33.

Figure 8—figure supplement 12.

(A) Atypical MBON33 (γ2γ3) is shown here and in Figure 8—video 12. Presynaptic sites are shown in yellow and postsynaptic sites are shown in gray. MBON33 gets about one-third of its input synapses within the γ lobe of the MB, mostly in the γ2 and γ3 compartments, and sends about 9% of its output to the LAL. (B) A pie chart showing the distribution of MBON33’s presynaptic sites (indicated in orange) and postsynaptic sites (in blue). The inner circle shows the total number of MBON33’s pre- and postsynaptic sites. The outer circle of the pie chart shows the brain regions in which these sites occur; regions of the MB are shown in lighter colors. (C) MBON33’s top 10 inputs (left) and outputs (right) outside the MB lobes are shown by neuron type as bar charts. The numbers in each row represent synapse numbers and the brain regions in which these synapses occur are color-coded. (Left) T he numbers next to each row indicate the percentage of that neuron’s synaptic output that goes to MBON33. Links to these cell types in neuPrint are: CRE074, CL129, SMP178, mALD1, LAL100, mALD4, CRE078, SMP238, MBON35, and CRE108. (Right) T he numbers next to each row indicate the fraction of that neurons input that is provided by MBON33. Links to these cell types in neuPrint are: PVLP034, PPL102, EBCREFB4,5 (FB4Y), SMP178, OA-VPM3, SMP175, SMP181, PPL201, CRE105, and LALSIPFB4 (FB4L).
Figure 8—figure supplement 13. Atypical MBON34.

Figure 8—figure supplement 13.

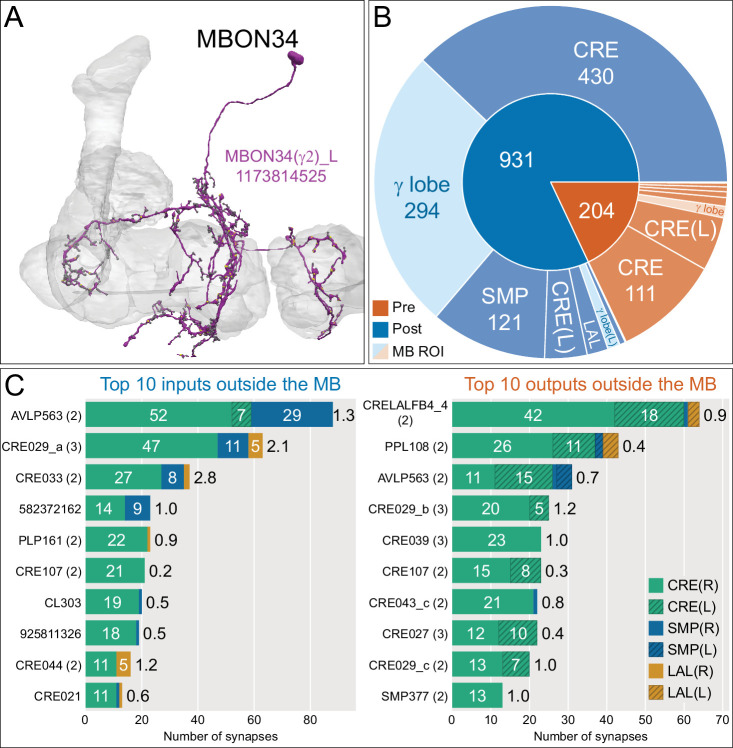
(A) Atypical MBON34 (γ2) is shown here and in Figure 8—video 13. Presynaptic sites are shown in yellow and postsynaptic sites are shown in gray. MBON34 has a small arbor and gets about one-third of its synapses from the γ2 compartment inside the MB lobes. (B) A pie chart showing the distribution of MBON34’s presynaptic sites (indicated in orange) and postsynaptic sites (in blue). The inner circle shows the total number of MBON34’s pre- and postsynaptic sites. The outer circle of the pie chart shows the brain regions in which these sites occur; regions of the MB are shown in lighter colors. (C) MBON34’s top 10 inputs (left) and outputs (right) outside the MB lobes are shown by neuron type as bar charts. The numbers in each row represent synapse numbers and the brain regions in which these synapses occur are color-coded. (Left) T he numbers next to each row indicate the percentage of that neuron’s synaptic output that goes to MBON34. Links to these cell types in neuPrint are: AVLP563, CRE029_a, CRE033, 582372162, PLP161, CRE107, CL303, 925811326, CRE044, and CRE021. (Right) T he numbers next to each row indicate the fraction of that neuron's input that is provided by MBON34. Links to these cell types in neuPrint are: CRELALFB4 _4 (FB4H), PPL108, AVLP563, CRE029_b, CRE039, CRE107, CRE043_c, CRE027, CRE029_c, and SMP377.
Figure 8—figure supplement 14. Atypical MBON35.

Figure 8—figure supplement 14.

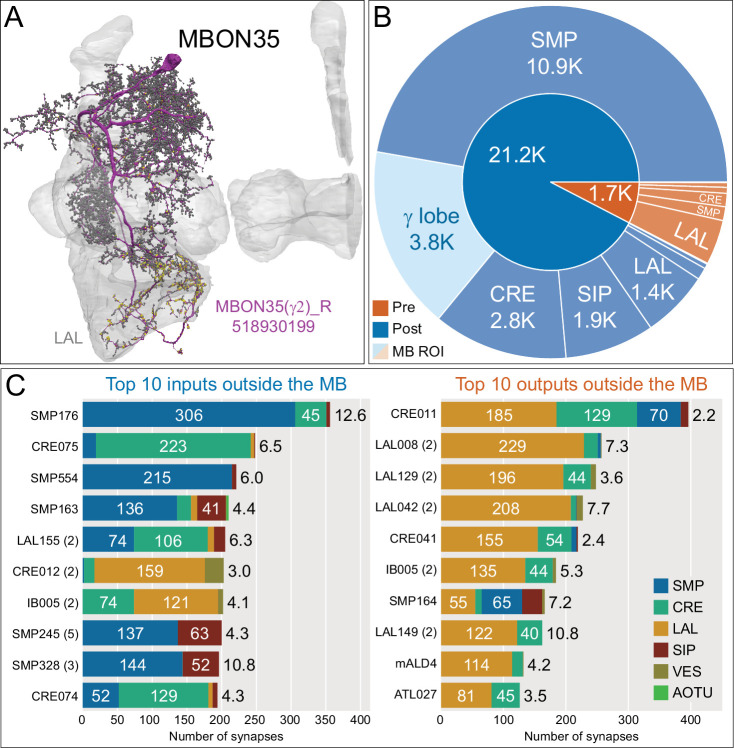
(A) Atypical MBON35 (γ2) is shown here and in Figure 8—video 14. Presynaptic sites are shown in yellow and postsynaptic sites are shown in gray. MBON35 gets about 20% of its input from the γ2 compartment inside the MB lobes and sends about half its output to the LAL. (B) A pie chart showing the distribution of MBON35’s presynaptic sites (indicated in orange) and postsynaptic sites (in blue). The inner circle shows the total number of MBON35’s pre- and postsynaptic sites. The outer circle of the pie chart shows the brain regions in which these sites occur; regions of the MB are shown in lighter colors. (C) MBON35’s top 10 inputs (left) and outputs (right) outside the MB lobes are shown by neuron type as bar charts. The numbers in each row represent synapse numbers and the brain regions in which these synapses occur are color-coded. (Left) The numbers next to each row indicate the percentage of that neuron’s synaptic output that goes to MBON35. Links to these cell types in neuPrint are: SMP176, CRE075, SMP554, SMP163, LAL155, CRE012, IB005, SMP245, SMP328, and CRE074. (Right) The numbers next to each row indicate the fraction of that neurons input that is provided by MBON35. Links to these cell types in neuPrint are: CRE011, LAL008, LAL129, LAL042, CRE041, IB005, SMP164, LAL149, mALD4, and ATL027.
Figure 8—figure supplement 15. Atypical MBON input distribution by brain region and similarity of inputs to different MBONs.

Figure 8—figure supplement 15.

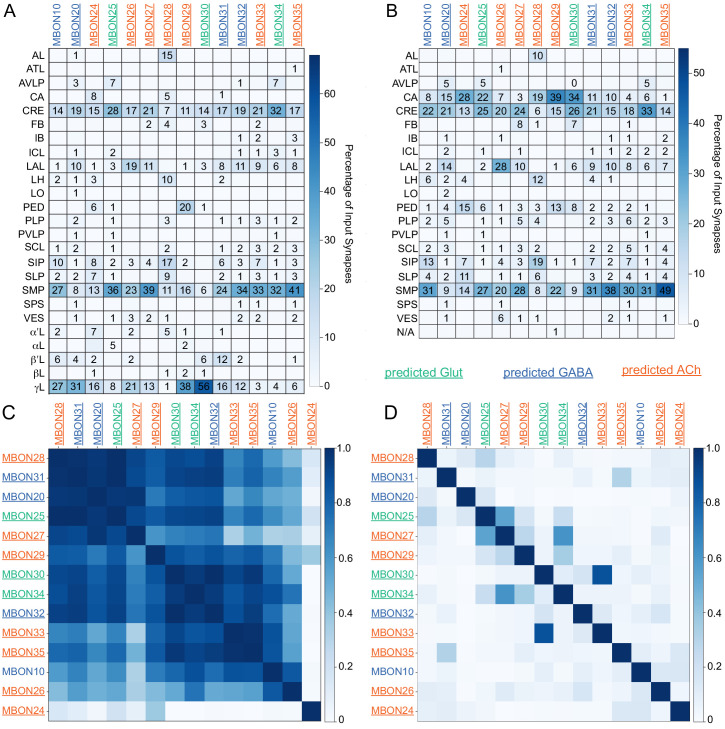
(A–B) Distribution of brain regions providing input to atypical MBON types. The value in each box indicates the effective input to the indicated MBON from the indicated brain region; that is, based on where the neurons making synapses onto the MBONs get their own inputs. Effective input is a measure that takes into account both the strength of the connection of each of the neurons that provides input to the MBON and the connection strength of other neurons to each of those input neurons in each brain region. Effective input is computed by matrix-multiplying the inputs to the MBONs and the inputs to those MBON-presynaptic neurons (normalizing both matrices so that inputs to all neurons sum to 1). Blank boxes indicate values of less than 1%. Input received inside MB lobes is included in A and excluded in B. (C) Cosine similarity between MBON types based on their input at the level of brain regions, with the MB excluded. (D) Cosine similarity between each MBON based on their inputs, with the MB excluded and the computation of the degree of input overlap performed at the level of individual presynaptic neurons. The ordering of MBONs in C and D was determined using spectral clustering.
Figure 8—video 1. Atypical MBON10.
Download video file (11.6MB, mp4)
Figure 8—video 2. Atypical MBON20.
Download video file (10.2MB, mp4)
Figure 8—video 3. Atypical MBON24.
Download video file (66.7MB, mp4)
Figure 8—video 4. Atypical MBON25.
Download video file (7.2MB, mp4)
Figure 8—video 5. Atypical MBON26.
Download video file (9.4MB, mp4)
Figure 8—video 6. Atypical MBON27.
Download video file (8.6MB, mp4)
Figure 8—video 7. Atypical MBON28.
Download video file (22.1MB, mp4)
Figure 8—video 8. Atypical MBON29.
Download video file (8.9MB, mp4)
Figure 8—video 9. Atypical MBON30.
Download video file (44.1MB, mp4)
Figure 8—video 10. Atypical MBON31.
Download video file (8MB, mp4)
Figure 8—video 11. Atypical MBON32.
Download video file (9.2MB, mp4)
Figure 8—video 12. Atypical MBON33.
Download video file (54.7MB, mp4)
Figure 8—video 13. Atypical MBON34.
Download video file (7.2MB, mp4)
Figure 8—video 14. Atypical MBON35.
Download video file (12.6MB, mp4)