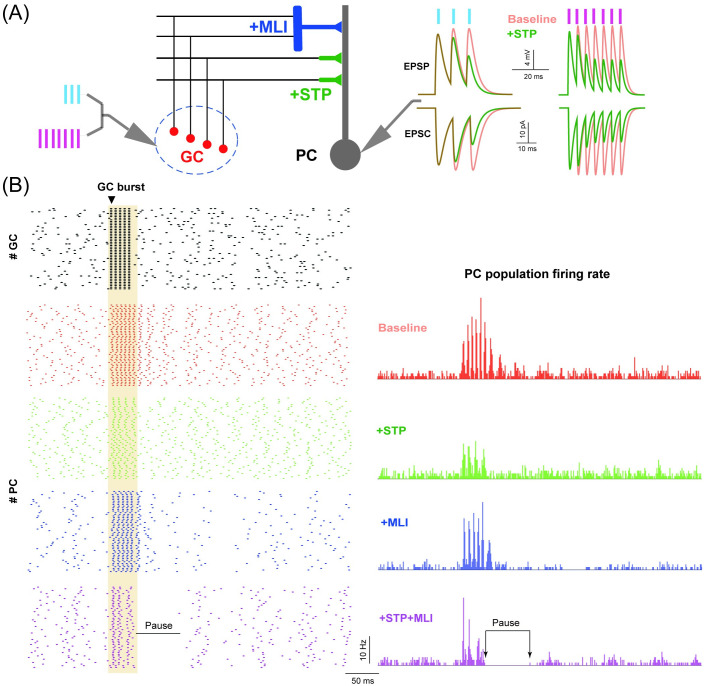
Fig 7. PC network dynamics in response to burst input.
(A) Schematic illustration of GC-PC and GC-MLI-PC pathways receiving burst inputs. (Left) GCs stimulated by bursts with 3 and 7 spikes at 100 Hz. (Right) EPSPs and EPSCs recorded from PCs for different burst inputs in the baseline condition (red) and with STP on (green). (B) GC spike raster triggered by a burst input of 5 spikes at 200 Hz, only 50 GCs are shown (top). (Bottom) The corresponding spike rasters of 50 PCs (left), and averaged PC population firing profiles in different conditions. Note that the pause response indicated as the time interval between two arrows in the condition of +STP+MLI only.

