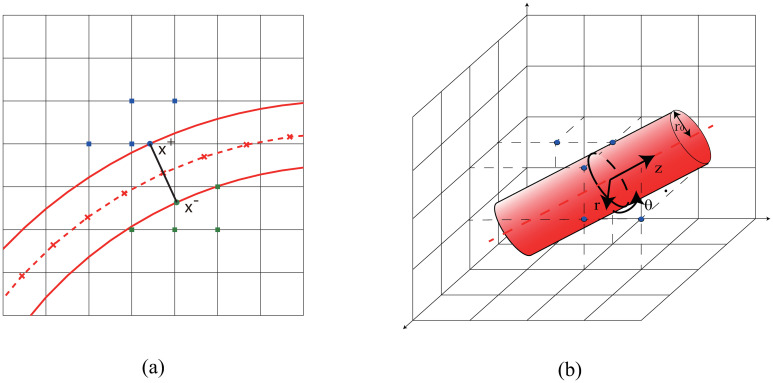
Fig 10.
(a) Evaluation of oxygen flux in 2D. The red solid lines represent the vessel wall. The red dashed line shows the center line of the blood vessel, the crosses on which show the discrete nodes. The blue (green) solid circle shows x+ (x−), whereas the blue (green) solid squares show the nearest mesh points used to fit the linear function and evaluate the flux. (b) Evaluation of oxygen flux in 3D. The red dashed line shows the center line of the blood vessel. The black circle shows the cross-section of blood vessel, whereas the blue (green) solid squares show the nearest mesh points used to fit the solution and evaluate the flux.

