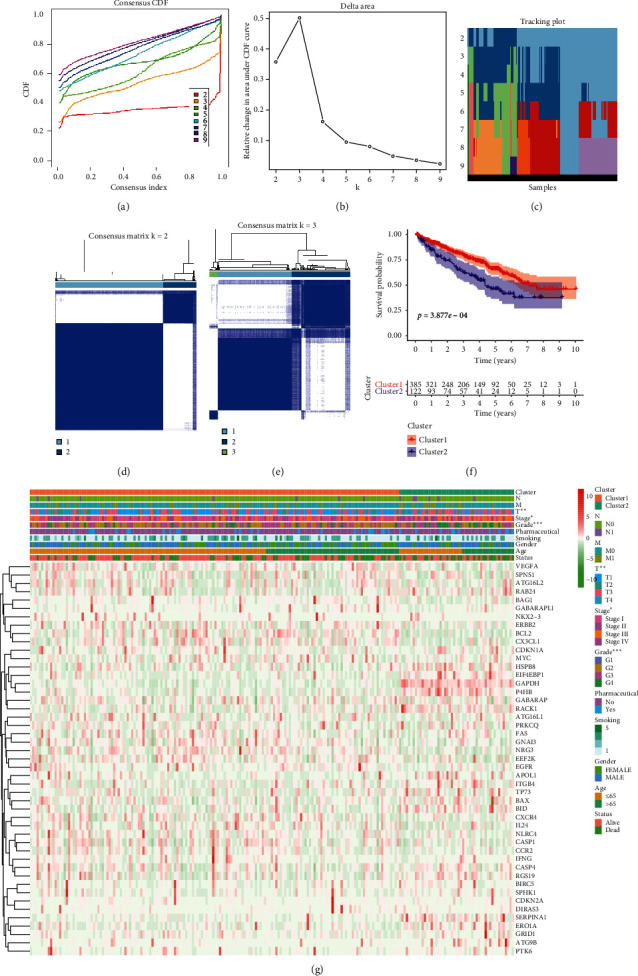
Figure 4.

Differential clinicopathological characteristics and overall survival (OS) in KIRC clusters 1 and 2. (a) Consensus clustering cumulative distribution function (CDF) for k = 2 to 10. (b) Relative change in area under CDF curve for k = 2 to 10. (c) Tracking plot for k = 2 to 10. (d-e) Consensus clustering matrix for k = 2 (d) and k = 3 (e). (f) Heatmap and clinicopathological characteristics of the 2 clusters (cluster1 and cluster2) defined by ARG consensus expression. (g) Kaplan–Meier curves for KIRC patients.
