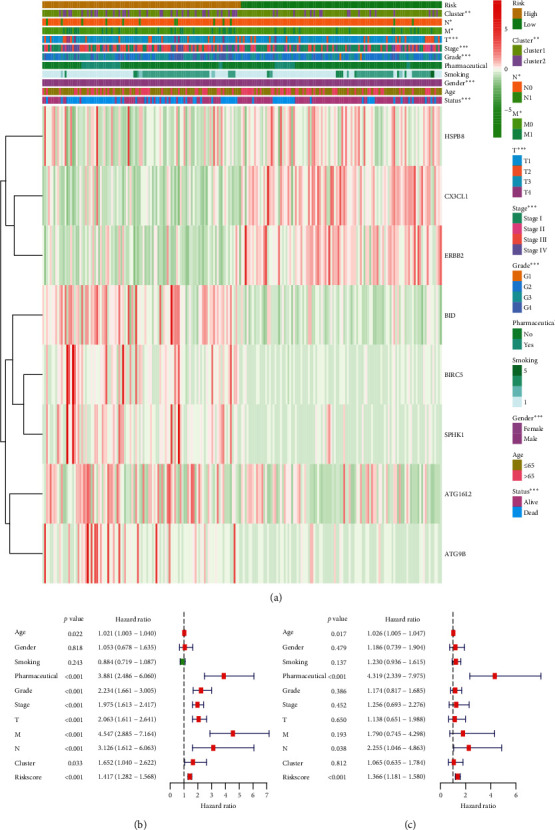
Figure 7.

Relationship between the risk score, clinicopathological features, and cluster1/2 subgroups in 215 KIRC patients. (a) The heatmap of the 8-ARG expression in low- and high-risk KIRC. Clinicopathological feature distribution was compared in low- vs. high-risk groups. ∗∗p = <0.01; ∗∗∗p = <0.001. Forest plot of univariate (b) and multivariate (c) Cox regression analyses in KIRC.
