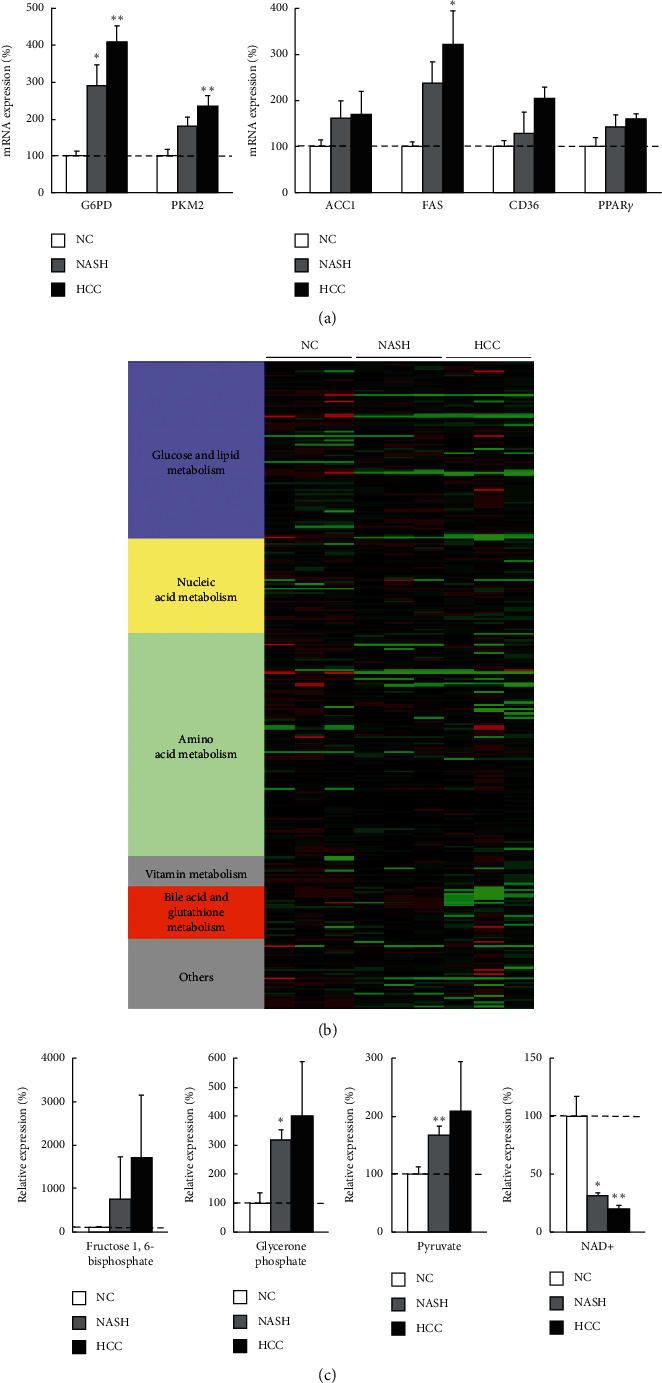
Figure 3.

Gene expression analysis and metabolomics of liver samples from mouse NASH-HCC model. (a) Quantitative RT-PCR analysis of metabolic genes related to glycolysis, FA synthesis and uptake, and TG synthesis in cancer tissues (HCC) and noncancer tissues (NASH) from melanocortin-4 receptor-deficient (MC4R–KO) mice fed a western diet for 60 weeks. The gene expression levels were normalized to those of wild-type (WT) mice as normal control (NC) and were presented as mean ± SE. ∗p < 0.05 and ∗∗p < 0.01 vs. NC. (b) Heat map analysis of metabolomics in NC, NASH, and HCC. It was generated by coloring the values of all data across their value ranges. The color red demonstrated that the relative content of metabolites is high and green demonstrates that they are low. The brightness of each color corresponded to the magnitude of the difference when compared with the average value. (c) The amounts of glycolysis-related metabolites and NAD+ in NASH and HCC normalized to those in NC were presented as mean ± SD. ∗p < 0.05, ∗∗p < 0.01 vs. NC. NASH, nonalcoholic steatohepatitis; HCC, hepatocellular carcinoma; G6PD, glucose-6-phosphate dehydrogenase; PK, pyruvate kinase; ACC, acetyl-coenzyme A carboxylase; FAS, fatty acid synthase; SREBP, sterol regulatory element-binding protein; PPAR, peroxisome proliferator-activated receptor; NAD, nicotinamide adenine dinucleotide.
