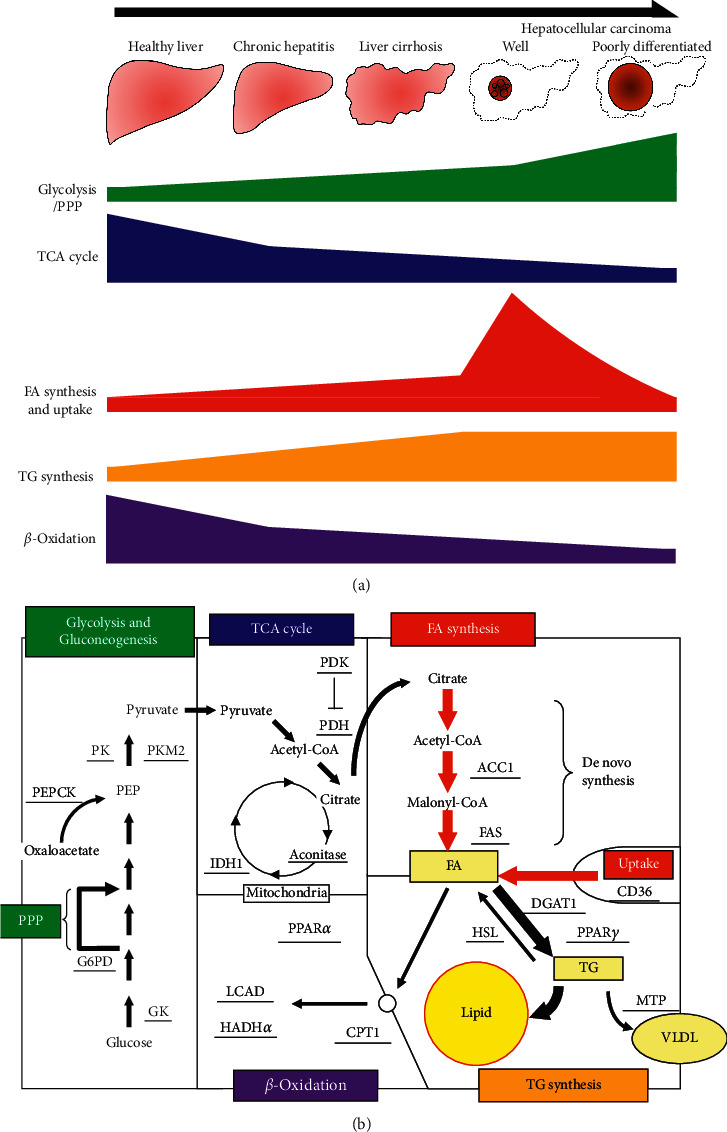
Figure 5.

Schematic figures of metabolic alterations in HCC. (a) The schematic figure showing the metabolic alteration as liver disease progresses from normal liver, chronic hepatitis, cirrhosis, to well- and poorly differentiated HCC. Glycolysis and pentose phosphate pathway (PPP) were increased and the TCA cycle and β-oxidation were decreased throughout the disease progression course. FA synthesis and uptake were gradually increased until HCC development, while those of well-differentiated HCC were the highest and decreased as the degree of differentiation progressed. (b) Comprehensive schematic figure showing the metabolic features in the well-differentiated HCC. The thick arrows represent increased biochemical reactions indicated by gene expression analysis. GK, glucokinase; G6PD, glucose-6-phosphate dehydrogenase; PEP, phosphoenolpyruvate; PEPCK, phosphoenolpyruvate carboxykinase; PK, pyruvate kinase; PDH, pyruvate dehydrogenase; PDK, pyruvate dehydrogenase kinase; IDH, isocitrate dehydrogenase; ACC, acetyl-coenzyme A carboxylase; FAS, fatty acid synthase; PPAR, peroxisome proliferator-activated receptor; DGAT, diacylglycerol acyltransferase; HSL, hormone-sensitive lipase; MTP, microsomal triglyceride transfer protein; CPT, carnitine palmitoyltransferase; LCAD, long chain acyl-coenzyme A dehydrogenase; HADH, hydroxyacyl-coenzyme A dehydrogenase.
