Figure 5.
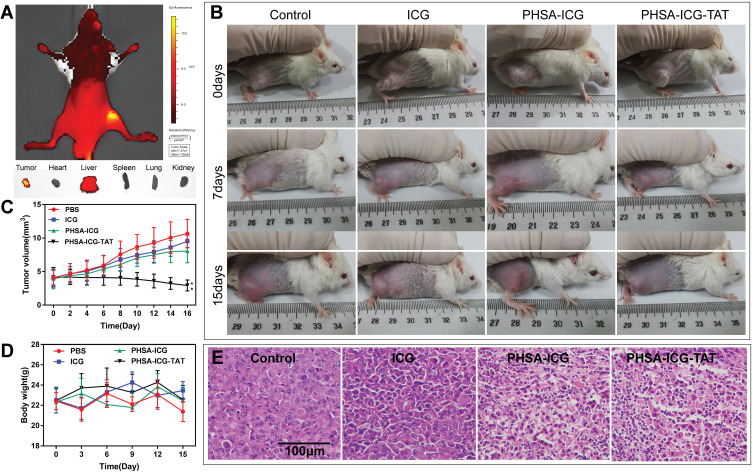
Anti-tumor effect of PHSA-ICG-TAT in vivo. (A) Fluorescence imaging of 4T1 tumor-bearing mice, tumors, heart, liver, spleen, lung, and kidney at 24 h after injection of PHSA-ICG-TAT. (B) Images of the 4T1 cell tumor xenograft-bearing mice captured before treatment (day 0), and at 7 and 15 days after treatment with PBS, free ICG, PHSA-ICG or PHSA-ICG-TAT, and laser exposure at 200 mW/cm2 for 5 min. (C) Tumor-growth curves of different groups of tumor-bearing mice after treatment. The error bars represent the standard deviations of six mice per group (**P<0.01, compared with the control group). (D) Body weights of different groups of tumor-bearing mice after treatment. (E) H&E-stained tumor sections collected from different groups of mice 7 days post treatment.
Abbreviations: H&E, hematoxylin and eosin; ICG, indocyanine green; PHSA, PEGylated human serum albumin.

