Figure 4.
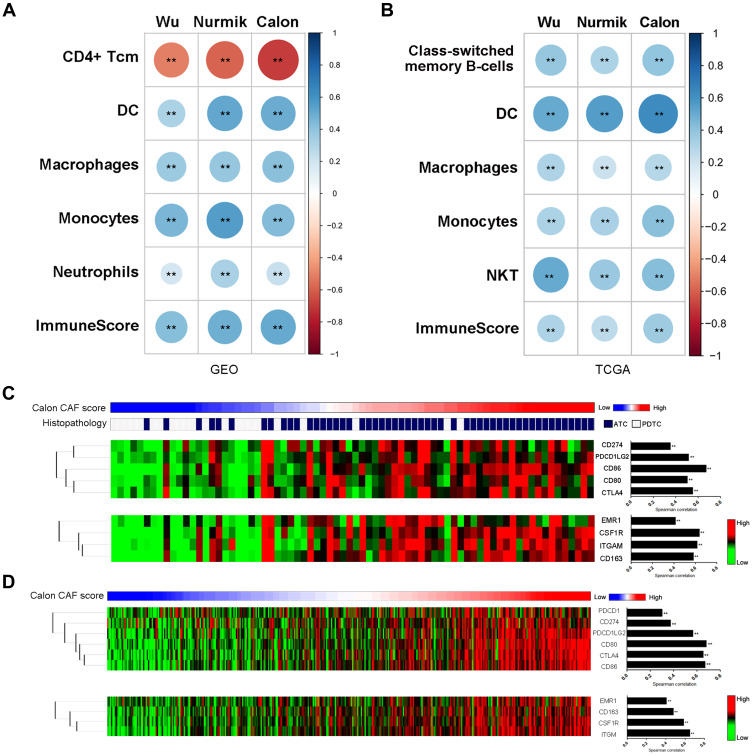
Impact of CAFs on immune microenvironment. (A–B) Enrichment analyses of CAF-associated immune cell types in DDTC patients from the combined GEO cohort (A) and PTC patients from the TCGA cohort (B). (C) The DDTC patients were ranked by the Calon signature score, histopathological subtypes, immune checkpoint markers and activated tumor-associated macrophage markers. (D) The PTC patients were ranked by the Calon signature score, immune checkpoint markers and activated tumor-associated macrophage markers. Spearman correlation was performed to analyse the linear correlation of the CAF score with expression value of immune microenvironment markers. **p<0.01.

