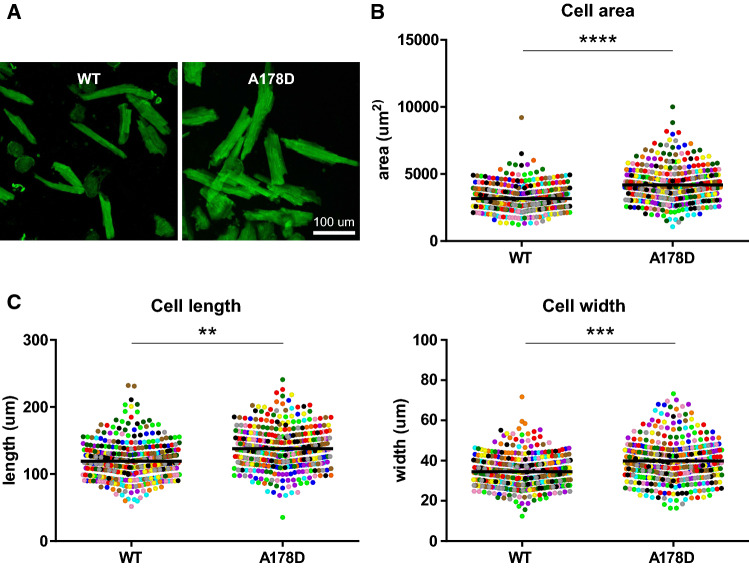
Fig. 2.
Altered cellular characteristics in A178D hearts. a Image of isolated cardiomyocytes from WT and A178D hearts, stained with wheat germ agglutinin (WGA). b, c Quantification of cellular dimensions: b cellular area, c left—cell length, right—cell width. Values of each measured cell are shown as individual data points, colour coded by the heart they are isolated from, means are indicated by black bar. (Total of 392/369 cells from 12 independent isolations from 4 female and 8 male mice each for WT/A178D, age: 128 ± 8 days/132 ± 10 days WT/A178D; Student’s t test using hierarchical clustering see Methods). For size distribution per isolation see Fig. S7, for summary of results Table S6

