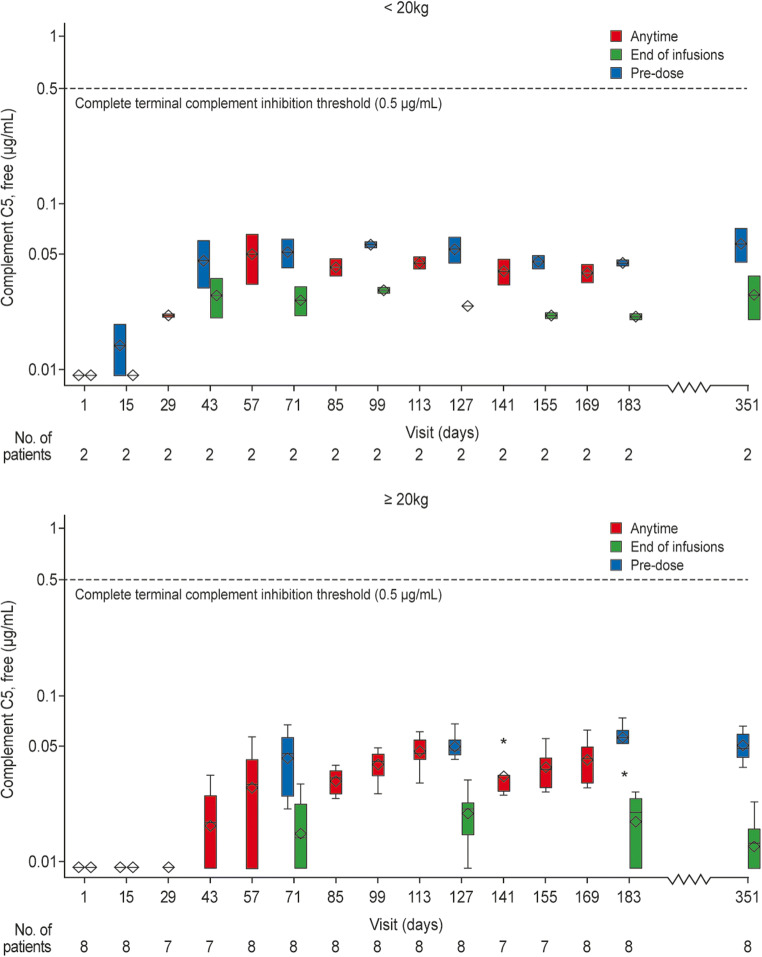
Fig. 4.
Free C5 concentrations over time (PK/PD analysis set). A dashed line is drawn at 0.5 ug/ml free C5 to denote the threshold for complete terminal complement inhibition. The horizontal line in the middle of each box indicates the median, a diamond indicates the mean, and the top border and the bottom border of the boxes mark the 75th and 25th percentiles, respectively. The whiskers represent the highest and lowest values within 1.5 times the interquartile range from the lower quartile and upper quartile. Outliers are represented by an asterisk beyond the whiskers. Patients weighing < 20 kg (a) and patients weighing ≥ 20 kg (b). PD pharmacodynamic, PK pharmacokinetic

