Fig. 3.
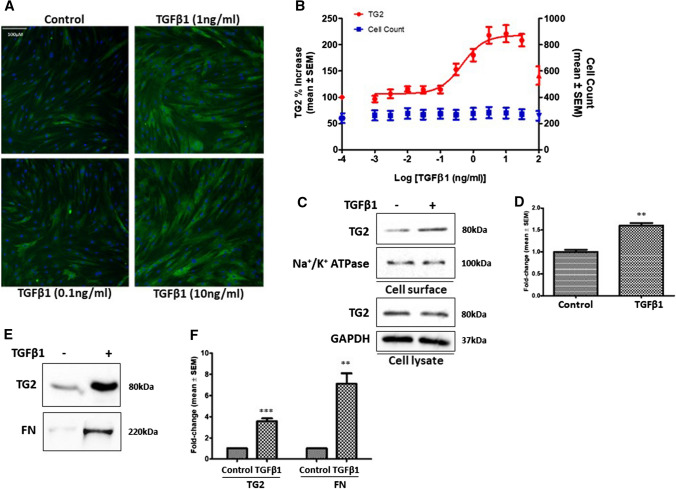
TGFβ1 stimulation of NHLFs regulates TG2 protein levels and ECM deposition. a Representative images of TG2 staining (green) in NHLFs treated with different concentrations of TGFβ1 with Hoechst (blue) staining. b Dose–response curve of TG2 levels against log TGFβ1 concentration. Mean percentage increase ± SEM in cell count (blue) also shown. The images were quantified as described in “Materials and methods”. c–f Representative Western blots of TG2 in cell surface and cell lysates c and matrix TG2 and FN f following treatment of NHLFs with TGFβ1 (1 ng/ml). Na + /K + ATPase was used as a cell surface loading control. Graphs based on densitometry analysis of Western blots with controls normalised to 1.0 are shown in d and f. GAPDH was used to ensure equal loading for cell lysates. Data are shown as a mean fold change ± SEM of control cells. **, p < 0.01; and ***, p < 0.001

