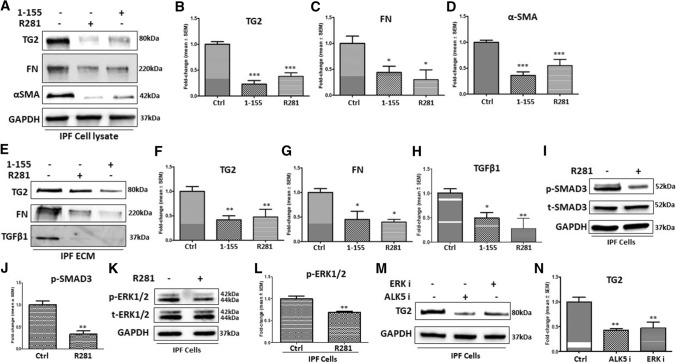
Fig. 7.
Treatment of IPF fibroblasts with TG2-specific inhibitors and the relationship with Smad3 and ERK1/2 signalling pathways. a Representative Western blot of TG2, FN and αSMA in control IPF fibroblasts and IPF fibroblasts treated with either TG2 inhibitor 1–155 (2.5 µM) or R281 (500 µM). e Representative Western blots of TG2, FN and TGFβ1 from ECM fractions of IPF cells treated as shown. i Representative Western blots of p-SMAD3 and t-SMAD3 and k p-ERK1/2 and t-ERK1/2 in the control IPF fibroblasts and R281 treated IPF fibroblasts. m Representative Western blots of TG2 in control IPF fibroblasts and IPF fibroblasts treated with an ALK5 or an ERK inhibitor. Graphs based on densitometry analysis of Western blots with controls normalised to 1.0 are shown in b–l and n. GAPDH was used to ensure equal loading data in the graphs are expressed as a mean fold change ± SEM compared to the control NHLFs *, p < 0.05; **, p < 0.01; and***, p < 0.001

