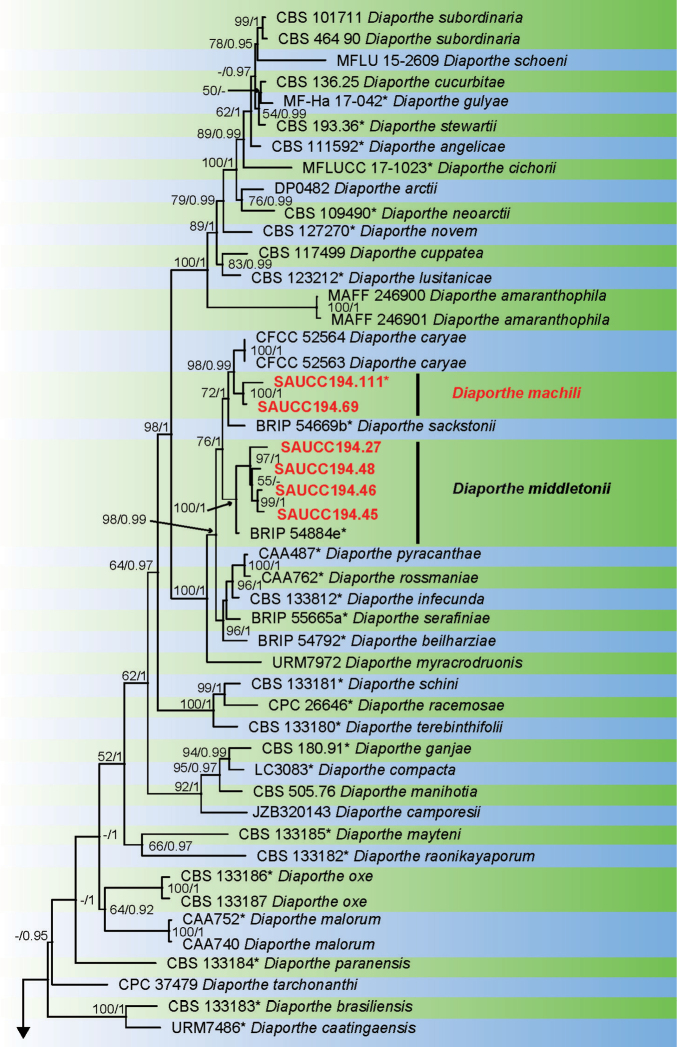
Figure 1.
Phylogram of Diaporthe spp. based on combined sequence data of ITS, TUB, TEF, CAL and HIS genes. The ML and BI bootstrap support values above 50% and 0.90 BYPP are shown at the first and second position, respectively. Strains marked with “*” are ex-type or ex-epitype. Codes referring to strains from the current study are written in red. Some branches were shortened to fit them to the page as indicated by two diagonal lines with the number of times a branch was shortened indicated.

