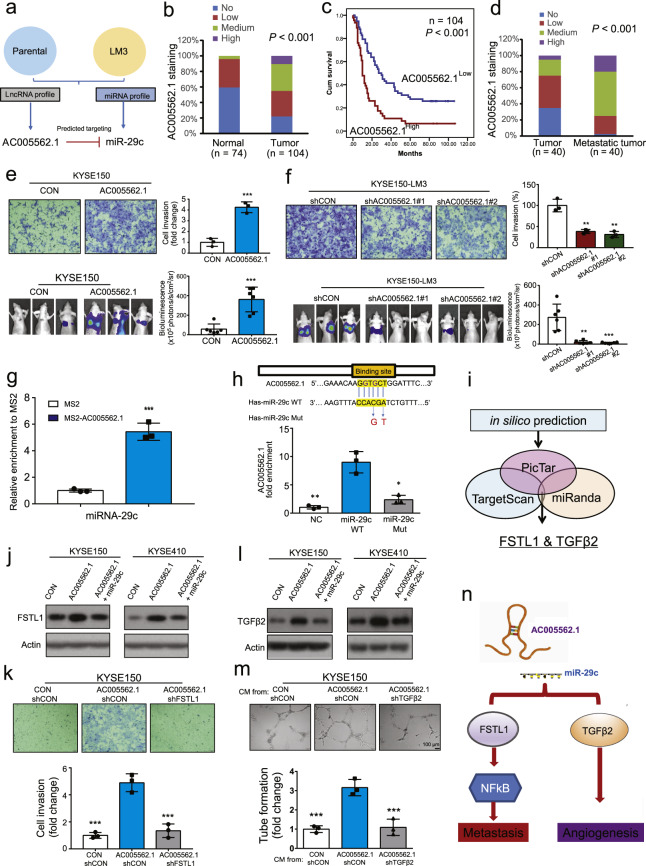
Fig. 1.
a Diagram showing the approaches used in the study to identify the AC005526-hsa-miR-29c regulatory pair. b Expression pattern of AC005562.1 and hsa-miR-29c in 74 normal tissues and 104 ESCC tissues. c Kaplan-Meier plots were used to compare the overall survival of 104 patients with ESCC stratified according to AC005562.1 or hsa-miR-29c expression. d Expression pattern of AC005562.1 and hsa-miR-29c in 40 pairs of primary esophageal cancer and matched metastatic tissues. e In vitro and in vivo assay comparing the invasion and metastasis between AC005562.1-overexpressing cells and vector control cells. f The invasion and metastasis of AC005562.1-knockdown cells and the vector control cells were compared. g MS2 RNA immunoprecipitation showing the binding between hsa-miR-29c and AC005562.1. h The wide-type or mutant forms of hsa-miR-29c are shown (upper panel). A pull-down assay showing that AC005562.1 was highly enriched in the sample pulled down by wild-type hsa-miR-29c but not mutant hsa-miR-29c. i Diagram showing the strategy to identify direct targets of hsa-miR-29c. j Western blot showing the expression of FSTL1 when the AC005562.1 and hsa-miR-29c expression was manipulated. k Boyden chamber assay showing the invasion of ESCC cells when the AC005562.1 and FSTL1 expression was manipulated. l Western blot showing the expression of TGFβ2 when the AC005562.1 and hsa-miR-29c expression was manipulated. m Tube formation assay showing that knockdown of TGFβ2 attenuated the promoting effect of AC005562.1 on angiogenesis in vitro. n Summary diagram. Bars, SD; **P < 0.01

