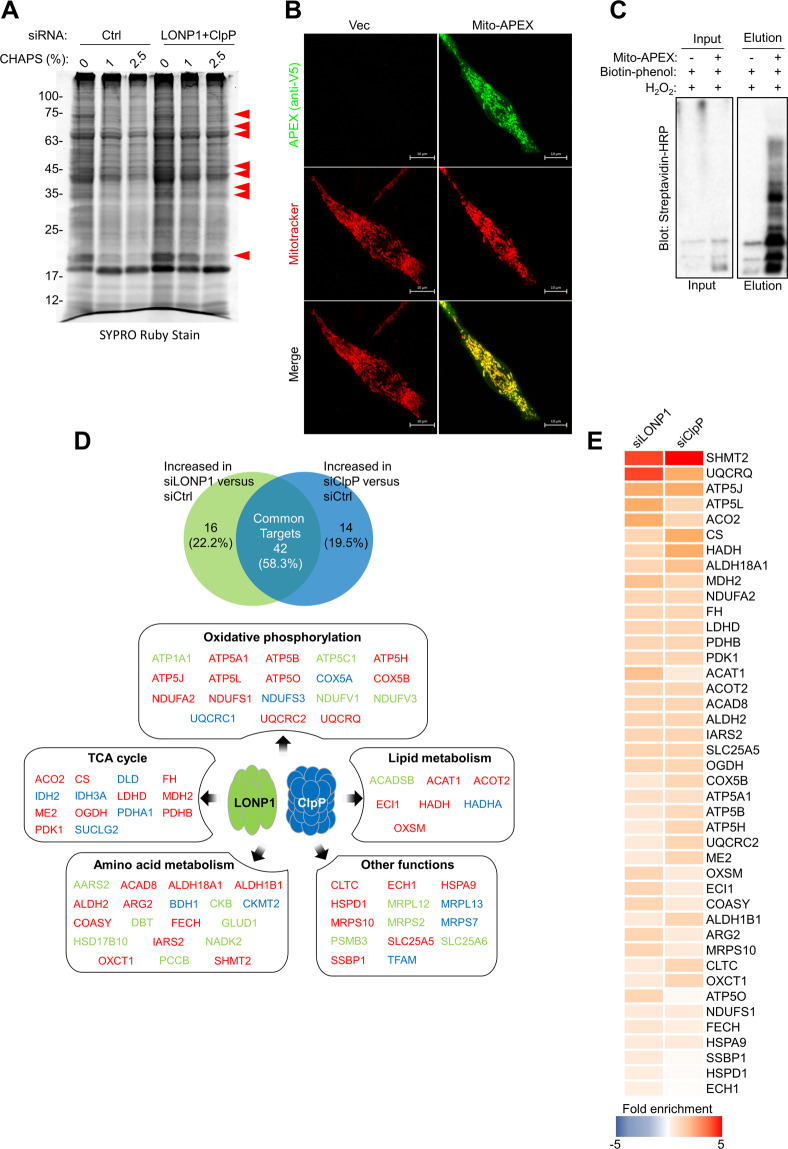
Fig. 4. Mitochondrial protein quality control by ClpP and LONP1.
A Mitochondrial proteins from LNCaP cells treated with control non-targeting siRNA (siCtrl) or LONP1 (siLONP1) and ClpP-directed siRNA (siClpP) for 48 h were incubated with increasing concentrations of detergent (CHAPS), separated by SDS gel electrophoresis, and visualized by SYPRO Ruby Stain. Aggregated and misfolded mitochondrial proteins are marked with arrowheads. B Representative confocal images of mitochondrial morphology in LNCaP cells expressing mito-APEX. Twenty-four hours after transfection, cells were fixed and stained with anti-V5 to detect mito-APEX expression. Mitotracker Deep Red staining was also used to visualize mitochondria. Scale bar=10 μm. C LNCaP cells were transiently transfected with mito-APEX. Twenty-four hours later, cells were incubated with the APEX substrate biotin-phenol and H2O2 for 1 min. Following cell lysis, biotinylated species were enriched by streptavidin pulldown. Western blot analysis of biotinylated mitochondrial proteins before (input) and after (elution) streptavidin bead enrichment. D APEX-based mitochondrial proteome analysis quantified by liquid chromatography-mass spectrometry for identification of direct target proteins for LONP1 or ClpP. Levels of 72 proteins were increased with a p < 0.05 and fold change ≥1.5 versus control siRNA in two independent experiments (n = 3). Upper, Venn diagram showing the number of mitochondrial proteins upregulated by silencing of LONP1 or ClpP. Bottom, target proteins categorized according to Gene Ontology enrichment analysis (DAVID). Red, common targets of LONP1 and ClpP; green, targets of LONP1; blue, targets of ClpP. E Fold increase in mitochondrial proteins with p < 0.05 that were common targets of ClpP and LONP1. Fold enrichment was determined relative to LNCaP cells transfected control siRNA. Data from two independent experiments are shown.

