Fig. 7.
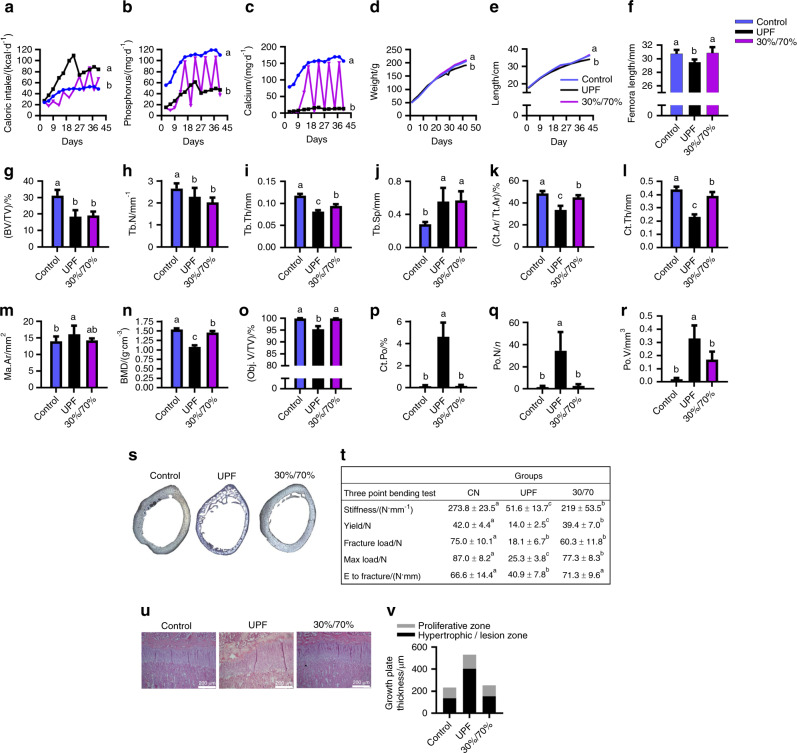
Partial consumption of ultra-processed food (UPF) leads to impaired skeletal quality. The UPF and control groups were compared to a group that received a balanced control diet 30% of the week and an ultra-processed diet (UPD) the rest of the week (30%/70% group). a Daily caloric intake (kcal·d−1 per rat). b Daily P intake (mg/rat per day). c Daily Ca intake (mg/rat per day). d Body weight. e Total length from nose to tail (cm). f Femur length (cm) at 9 weeks of age. g–r Femur µCT analyses. g–j Trabecular parameters: bone volume fraction (BV/TV), trabecular number (Tb. N), trabecular thickness (Tb. Th), and trabecular separation (Tb.Sp). k–n Cortical parameters: cortical area fraction (Ct.Ar/Tt. Ar), average cortical thickness (Ct. Th), medullary area (Ma. Ar) and bone mineral density (BMD). o–r Bone porosity parameters: percent object volume (Obj. V/TV), cortical porosity (Ct. Po), pore number (Po. N) and total pore volume (Po. V). s Light microscopy images of cross-sections of rat cortical bone representing cortical bone porosity. t Biomechanical parameters assessed by three-point bending test; CN, control. u Tibiae from the control, UPF and 30%/70% groups were dissected, processed and stained with hematoxylin and eosin. v Quantification of the relative ratio of the zones in the growth plate (GP). Values are expressed as the mean ± SD, n = 8. Different letters denote significant differences at P < 0.05 between groups

