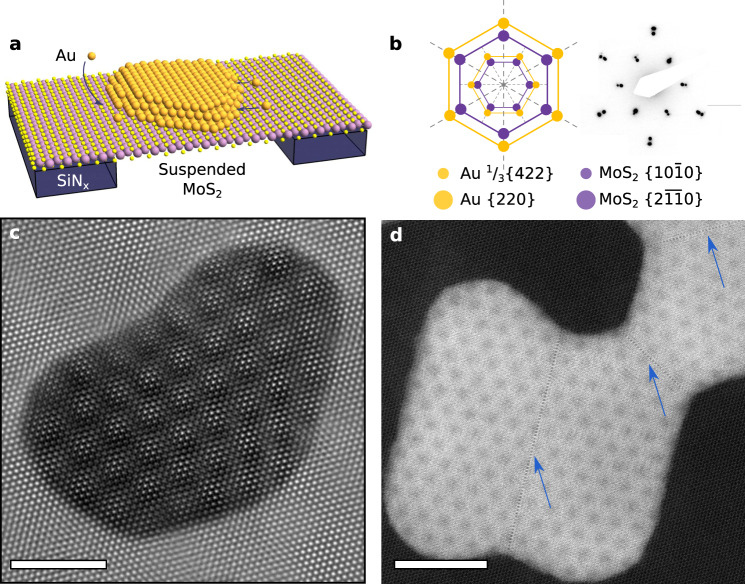
Fig. 1. HRTEM and STEM demonstrating epitaxial MoS2/Au{111} moiré.
a Schematic of epitaxially aligned Au deposited on suspended MoS2 supported on a SiNx TEM grid. Orange atoms represent Au, yellow S, and purple Mo. The SiNx membrane is shown in dark blue. b Reciprocal space model and experimental selected area electron diffraction pattern of the Au {111} zone aligned on MoS2 {0001}, with weak intensity 1/3{422}Au spots (see text) aligned with and higher intensity {220}Au spots aligned with . Orange dots represent frequencies from Au crystal planes, while purple represent frequencies from MoS2 crystal planes. c HRTEM image of Au nanoisland on MoS2, showing apparent 18 Å-period moiré pattern. Scale bar, 40 Å. d High angle annular dark field (HAADF) STEM image. Scale bar, 80 Å. Coalescence boundaries are marked by blue arrows.

