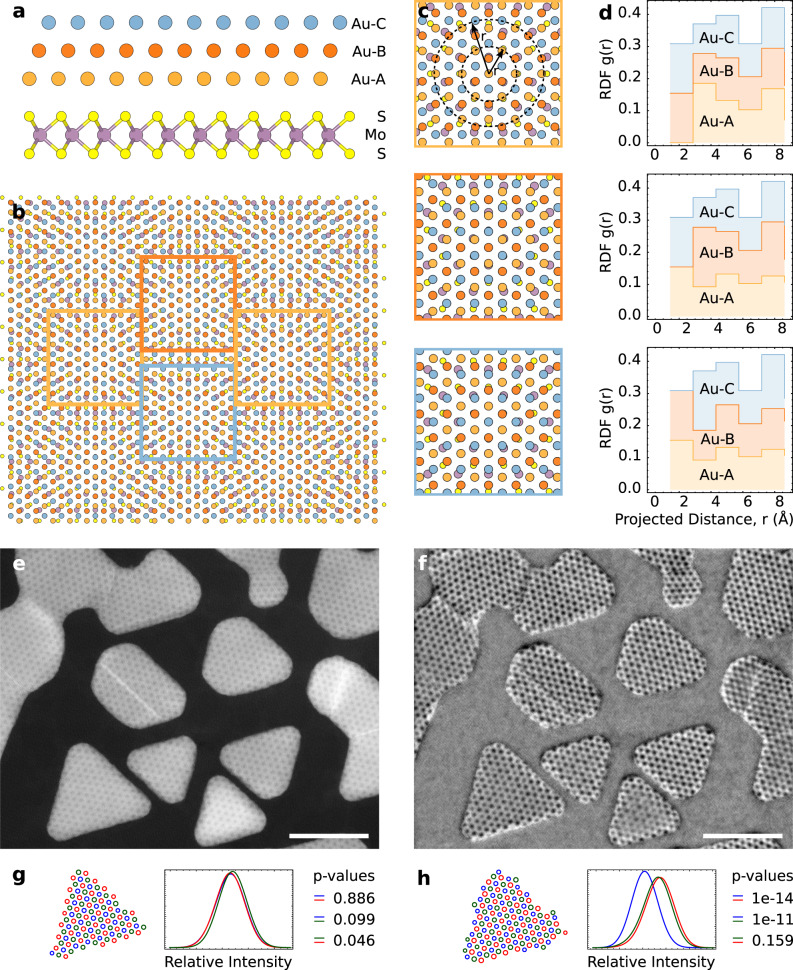
Fig. 2. Atomic models, RDFs, HAADF, and iDPC characterization of 32 Å moiré structure.
a Atomic model [100] zone axis for the 32 Å moiré with the Au atoms indicated (orange, red, blue) to highlight relative stacking of A, B, and C sites. b Plan view atomic model for the 32 Å moiré. Boxed areas represent three inequivalent sites in the 32 Å moiré. c Close up plan-view image of each of the sites highlighted in (b). r is the projected distance from the central aligned sites, and the dotted circles show two representative r values. d Corresponding RDFs of the three inequivalent sites in the 32 Å moiré. e HAADF and f iDPC STEM images showing the (apparent) 18 Å and 32 Å moiré cells, respectively. Scale bars 200 Å. g, h Relative intensity distributions and statistical variation of the three inequivalent sites in the island immediately above in the corresponding images. The equivalent disk radius for each spot was calculated and partitioned to inequivalent sites (red, green, blue). The histograms were smoothed using a gaussian kernel of radius 0.5 Å for visual clarity.

