Figure 3.
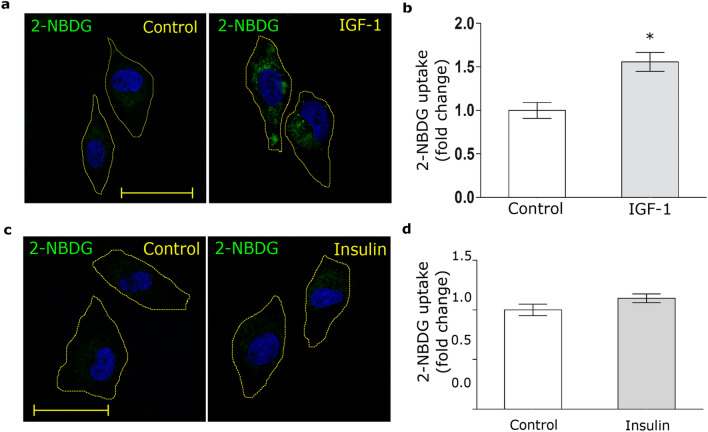
IGF-1 promotes glucose uptake. (a,c) Confocal microscopy in MIO-M1 cells treated with IGF-1 10 nM (a) or Insulin 10 nM (c) together with 2-NBDG 80 µM (green) for 30 min. Dotted line represents the cell shape. Images are representative of 20 cells per condition (n = 20). Scale bar = 15 μM. (b,d) Graph represents mean ± SEM of the fluorescence intensity of 2-NBDG per cell area expressed as fold change. *p < 0.05 versus non-stimulated control (white bar).

