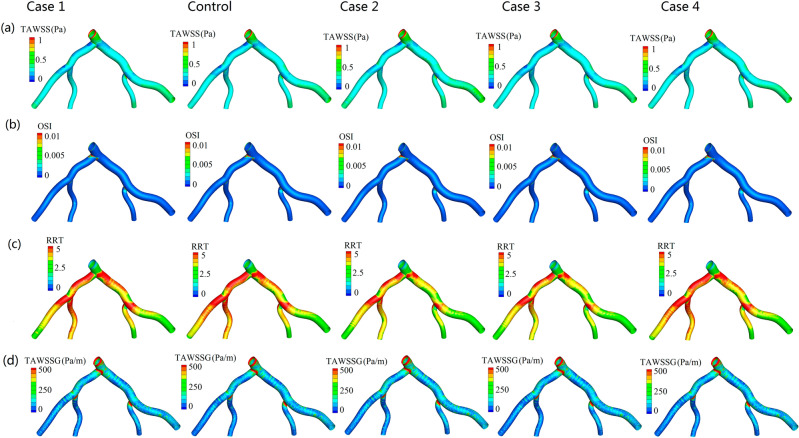
Figure 5.
Wall shear stress-based hemodynamic indicators distributions for the five simulations. (a) The distribution of time-averaged wall shear stress. (b) The distribution of oscillatory shear index. (c) The distribution of relative residence time. (d) The distribution of time-averaged wall shear stress gradient. time-averaged wall shear stress, oscillatory shear index, relative residence time, time-averaged wall shear stress gradient.

