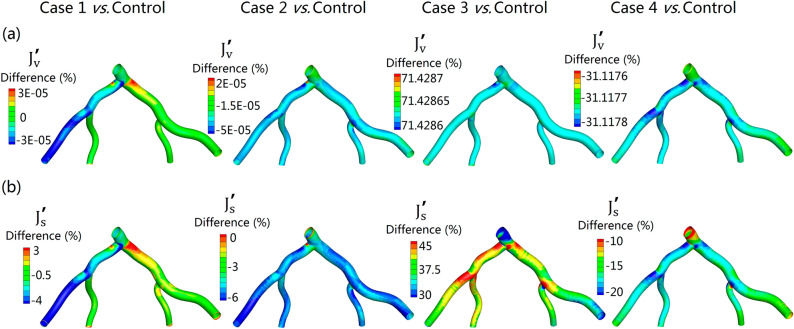
Figure 7.
Comparison of the three-pore model related indicators for the five simulations. (a,b) respectively represent the percentage difference of () and () between different experimental groups and Control simulation. (a) , (b) . Where Case 1 vs. Control: the distribution of the percentage difference between Case 1 with rigid wall and Control. Case 2 vs. Control: the distribution of the percentage difference between Case 2 with increased blood viscosity and Control. Case 3 vs. Control: the distribution of the percentage difference between Case 3 with hypertension and Control. Case 4 vs. Control: the distribution of the percentage difference between Case 4 with thickened wall and Control.

