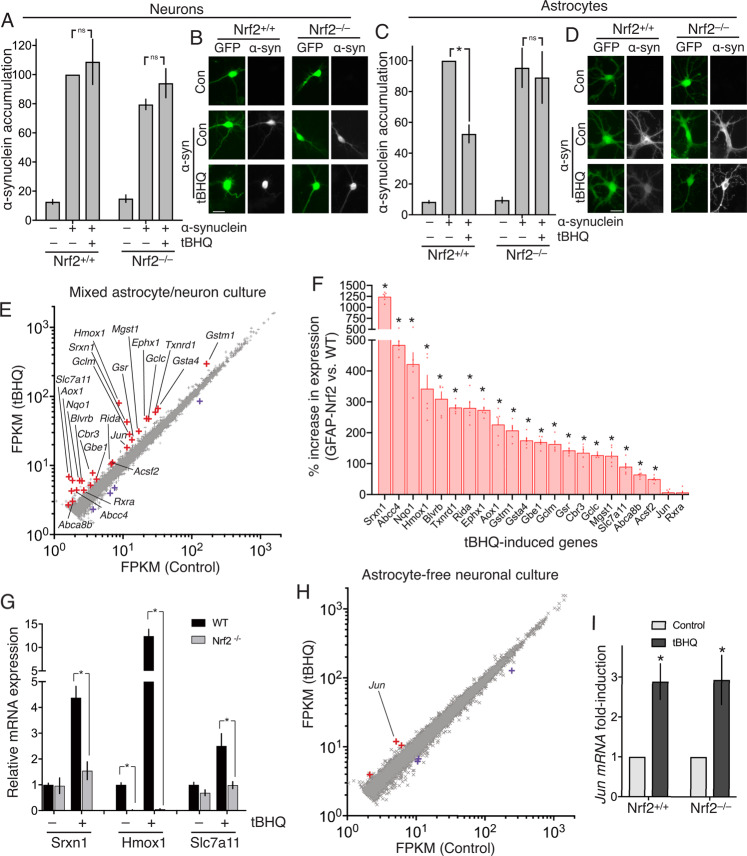
Fig. 1. Endogenous Nrf2 cannot clear α-synuclein or support an Nrf2-dependent transcriptional response in neurons, unlike astrocytes.
DIV10 (Days In Vitro) mixed neuron/astrocyte cultures were transfected on DIV3 with vectors encoding eGFP, plus either α-synuclein (pCAGS- α-synuclein) or a ß-globin control. 5 days post-transfection, cells were treated ± tBHQ (10 µM) for 24 h, fixed, and subjected to immunofluorescence cytochemistry (anti- α-synuclein antibody) (BD Transduction Laboratories, #610878 (1:1000)). Immunofluorescence images were taken and quantified (blind). Neurons and astrocytes were distinguished morphologically (astrocytes have larger nuclei, thick proximal processes, and an absence of axons), a method that was validated separately using neuronal (NeuN) and astrocytic (GFAP) markers. A, B Analysis and example pictures of neurons. 43-77 cells per condition, n = 4 independent experiments. Scale bar: 25 µm. C, D Analysis and example pictures of astrocytes. *P = 0.004 2-way ANOVA plus Tukey’s post-hoc test; n = 4 independent experiments (22–30 cells analysed for each condition). Scale bar: 25 µm. E DIV10 mixed neuron/astrocyte cultures17 were treated ± tBHQ (10 µM,) for 8 h, RNA extracted and subjected to RNA-seq analysis (ca. 35 × 106 paired-end reads/sample, 3 biological replicates; EBI ref: E-MTAB-5688). Mean data for the 11,698 genes expressed on average >2 FPKM is plotted. Differentially expressed genes (DESeq2 v1.6.3, Benjamini-Hochberg-adjusted P value < 0.05) are highlighted red (induced) or blue (repressed). Genes induced >1.5-fold are labelled. F Genes labelled in red in 1e were cross referenced to RNA-seq data from astrocytes over-expressing Nrf2 (FAC-sorted from the GFAP-Nrf2 mouse). Of the 22 genes that were expressed in this GFAP-Nrf2 RNA-seq data set >2 FPKM, the % difference in GFAP-Nrf2 astrocytes (vs. WT) is shown. *(p_adj<0.01, n = 5, see Supplemental Table S1 for exact p values). G qPCR analysis of the indicated genes in RNA extracted from mixed cultures of the indicated genotypes, treated with tBHQ as in 1e. * P value < 0.05 t test, n = 3–5 per condition. H Experiment performed as in (E) except that astrocyte-free neuronal cultures17 were employed. All 10,845 genes expressed on average >2 FPKM are plotted, and differentially expressed genes (DESeq2 v1.6.3, Benjamini-Hochberg-adjusted P value < 0.05) are highlighted red (induced) or blue (repressed). I Astrocyte-free Nrf2+/+ or Nrf2–/– cortical neurons were treated as in (F) and Jun mRNA expression analysed (by qPCR). *P = 0.005, 0.004 (reading left-to-right here and throughout the manuscript), 1-way ANOVA plus Sidak’s post-hoc test (n = 6).

