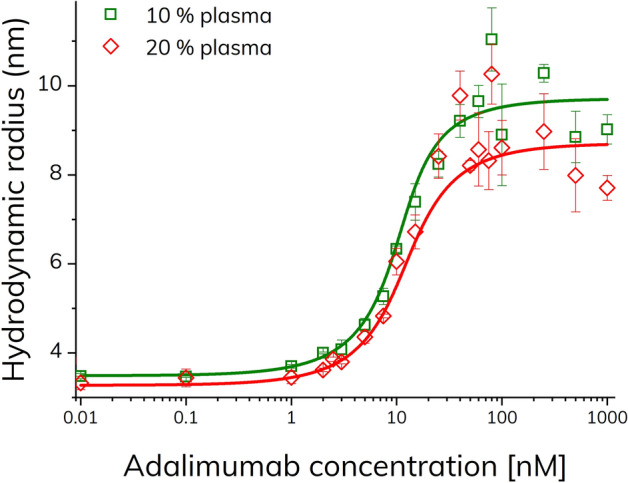
Figure 8.

Apparent hydrodynamic radius of TNF-α-alexa488 (100 nM) as function of adalimumab concentration (0–1000 nM) in 10% v/v human plasma (green squares) and 20% v/v human plasma (red diamonds), determined by FIDA at 25 °C (n = 3, error bars represent standard deviation) using pre-incubated samples (> 10 min). The solid lines represent fitting to the excess indicator binding isotherm [Eq. (7)] with R2 of 0.987 (green) and 0.979 (red), respectively.
