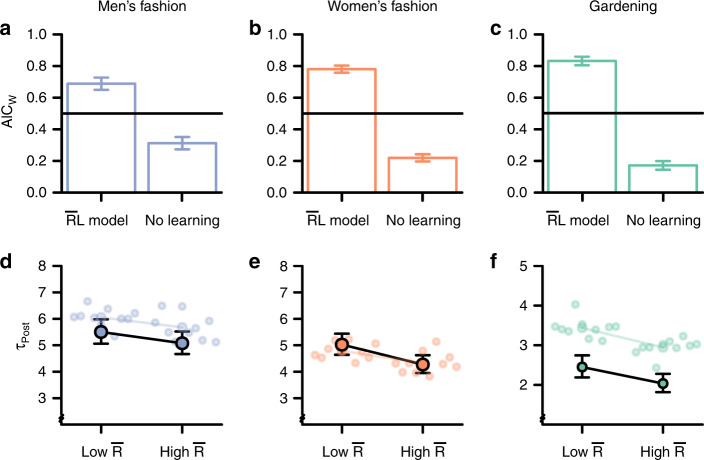
Fig. 3. Signatures of reward learning on three social media sites (Study 2).
a–c Model comparison shows that the model explained behavior on the three social media sites (total N = 2,127 independent individuals. a N = 543, b N = 773, c N = 813) better than a model without learning. The AICW expresses the relative likelihood for each model, and are presented as means +/− 99% CI. The horizontal line at 0.5 represents the chance level of no difference between models. The exceedance probability for the model was 1 in all three datasets. The distribution of AICW is displayed in Supplementary Fig. 3. Source data are provided as a Source Data file. d–f The model derived estimate of , the average reward rate, predicted the latency between posts on each social media platform (d N = 543, e N = 773, f N = 813 independent individuals). In line with reward learning theory, the latency between posts was shorter with high compared to low . The colored points indicate the corresponding estimates from simulated data, based on ten generative simulation runs of the model (see text for details). The colored lines show the average effect in the simulated data. Results are presented as means (fixed effects regression estimates) ± 99% CI from mixed-effects regressions.

