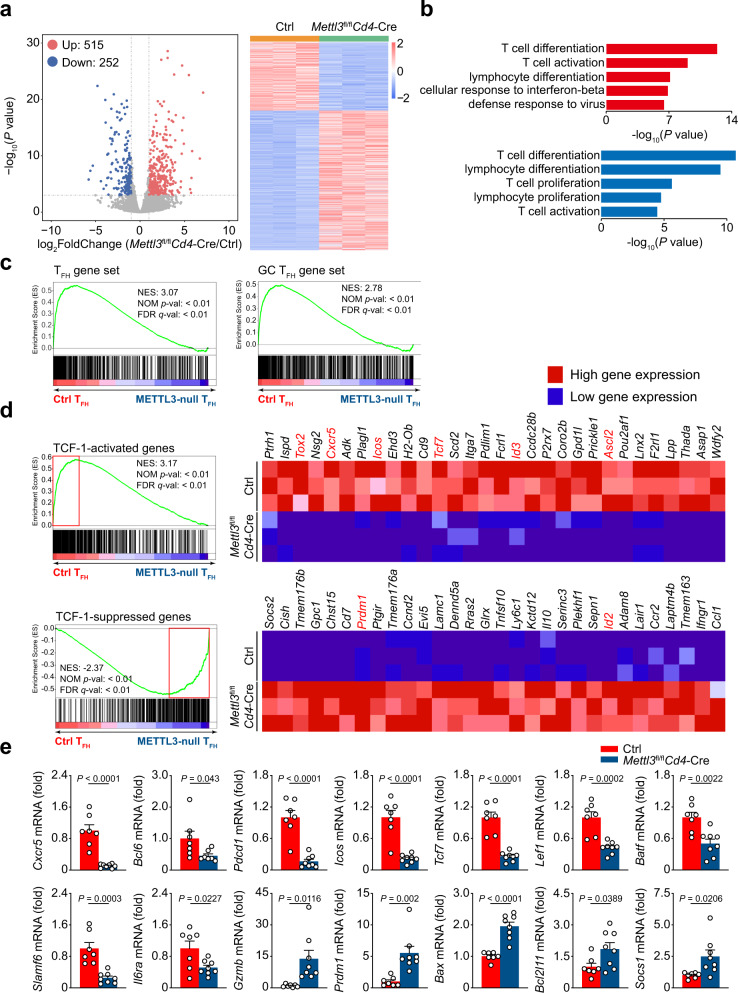
Fig. 4. Alternation of transcriptional profiles in METTL3-null TFH cells.
a Volcano map depicting genes upregulated (red) or downregulated (blue) 2-fold or more in TFH cells on 8 dpi. Heatmap of differentially expressed genes is shown on the right. b Gene Ontology (GO) terms of the differentially expressed genes in Mettl3fl/flCd4-Cre TFH cells compared with Ctrl TFH cells (Upregulated: top panel; Downregulated: bottom panel). c Gene set enrichment analysis (GSEA) of TFH and GC TFH gene set in Mettl3fl/flCd4-Cre TFH cells relative to expression in Ctrl TFH cells as in a. d GSEA analysis of “TCF-1-activated genes in TFH cells” and “TCF-1-suppressed genes in TFH cells” (GSE65693) in Mettl3fl/flCd4-Cre TFH cells relative to expression in Ctrl TFH cells as in a. Heatmaps representation of top 30 ranking genes in the leading edge are shown, respectively. e Quantitative RT-PCR analysis of selected interested genes in a, relative expression was normalized to that in Ctrl TFH cells (n = 7 for Ctrl group, n = 8 for Mettl3fl/flCd4-Cre group except Bcl6 gene (n = 7 per group)). Data are from one experiment with triplicates (a–d) or pooled from two experiments (e). Error bars indicate standard error of the mean. P value was calculated by unpaired two-tailed Student’s t test (e).

