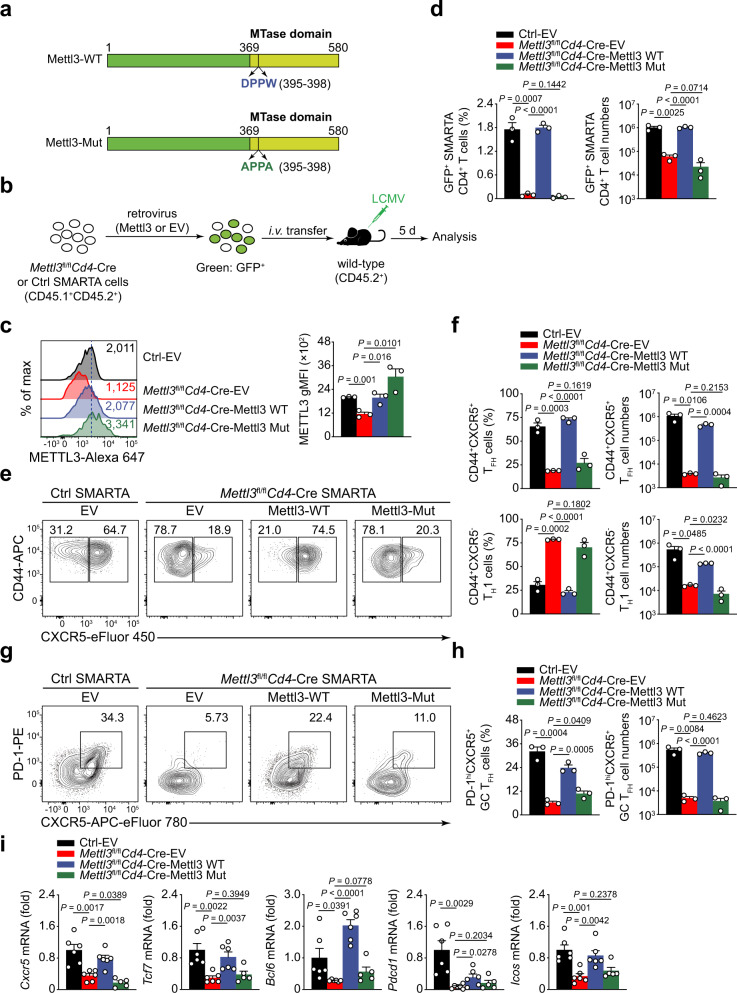
Fig. 5. METTL3 promotes TFH differentiation in an m6A catalytic activity-dependent manner.
a Graphic representation of the wild-type (Mettl3-WT) and catalytic domain dead (Mettl3-Mut; DPPW to APPA) METTL3 constructs. b Scheme of retrovirus transduction experiment. SMARTA cells were transduced with indicated structures by using a retrovirus transduction system. Then, the transduced cells were adoptively transferred into congenic CD45.2+ wild-type mice followed by LCMV-Armstrong infection, and analyzed on day 5 post viral infection. c Flow cytometry analysis of METTL3 gMFI in GFP+CD4+ SMARTA cells from recipient mice. Quantitation of METTL3 gMFI is shown on the right (n = 3 per group). d Summary of the frequency and cell numbers of retrovirus-transduced SMARTA CD4+ T cells in host mice (n = 3 per group). e, f Flow cytometry analysis of CD44+CXCR5+ TFH populations and CD44+CXCR5– TH1 subsets gated on SMARTA GFP+CD4+ T cells from host mice adoptively transferred with empty vector (EV), Mettl3-WT, or Mettl3-Mut retrovirus-introduced SMARTA cells. Summary of the frequency and cell numbers of TFH cells and TH1 cells are shown in f (n = 3 per group). g, h Flow cytometry analysis of PD-1hiCXCR5+ GC TFH populations gated on SMARTA GFP+CD4+ T cells from host mice adoptively transferred with EV, Mettl3-WT, or Mettl3-Mut retrovirus-introduced SMARTA cells. Summary of the frequency and cell numbers of GC TFH cells are shown in h (n = 3 per group). i Quantitative RT-PCR analysis of mRNA abundance of TFH cell-related genes in CD44+CXCR5+ TFH cells ectopically expressed with EV, Mettl3-WT, or Mettl3-Mut, relative expression was normalized to Ctrl cells transduced with EV retrovirus (n = 6 for Ctrl EV, Mettl3fl/flCd4-Cre-EV, and Mettl3fl/flCd4-Cre-Mettl3 WT group; n = 5 for Mettl3fl/flCd4-Cre-Mettl3 Mut group). Data are representative of two independent experiments. Error bars indicate standard error of the mean. P value was calculated by one-way ANOVA, followed by unpaired two-tailed Student’s t test for indicated pairwise comparisons.

