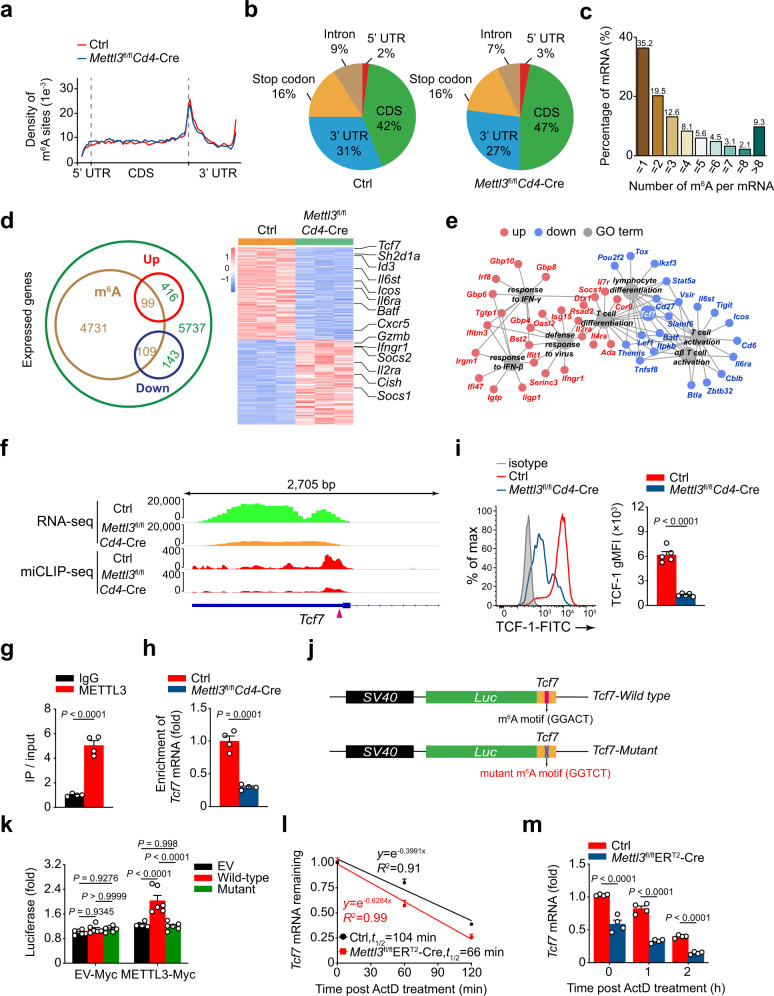
Fig. 6. m6A modifies Tcf7 mRNA to control its stability.
a Metagene profiles of m6A site distribution along a normalized transcript containing three rescaled non-overlapping segments: 5′ UTR, CDS, and 3′ UTR in Ctrl and Mettl3fl/flCd4-Cre SMARTA CD4+ T cells. b Pie chart showing the distribution of m6A sites in five regions of Ctrl and Mettl3fl/flCd4-Cre SMARTA CD4+ T cells. c Bar chart depicting percentage of mRNAs with different internal m6A abundance. d Venn diagram showing the overlapping differentially expressed genes from RNA-seq and m6A-modified transcripts from m6A-miCLIP-SMARTer-seq. Heatmap of 208 differentially expressed genes with m6A modification is shown on the right. e Representative GO terms of the biological process categories enriched in differentially expressed transcripts with m6A peaks (Red: upregulated genes; blue: downregulated genes; gray: GO terms). f Integrative Genomics Viewer (IGV) tracks displaying RNA-seq (top panel) and m6A-miCLIP-SMARTer-seq (bottom panel) reads distribution of Tcf7 gene. The high-confidence m6A site is marked as a triangle. g RIP-qPCR analysis showing enrichment of METTL3 on Tcf7 mRNA in SMARTA CD4+ T cells. The Tcf7 mRNA enrichment is presented as IP/input and normalized to IgG group (n = 4 per group). h m6A-RIP-qPCR analysis of m6A enrichment on Tcf7 mRNA of Ctrl and Mettl3fl/flCd4-Cre SMARTA CD4+ T cells (n = 4 per group). i Flow cytometry analysis of expression level of TCF-1 on TFH cells on 8 dpi. Quantification of gMFI of TCF-1 is shown on the right (n = 5 per group). j Constructions of plasmids with wild-type or m6A site mutant in Tcf7 3′ UTR. k Luciferase reporter assay. Results were normalized to the luciferase activity of cells co-transfected with the pGL4.23 empty plasmid and EV-Myc plasmid (n = 6 per group). l RNA decay assay. The half-live of Tcf7 mRNA was detected by quantitative RT-PCR. The remaining mRNAs were normalized to t = 0 (n = 4 per group). m Quantitative RT-PCR analysis of Tcf7 mRNA abundance as in l, relative expression was normalized to t = 0 of Ctrl cells (n = 4 per group). Data are from one experiment with duplicate (a–e) or representative of at least three independent experiments (i–h, k–m). Error bars indicate standard error of the mean. P value was calculated by unpaired two-tailed Student’s t test (g–i) or two-way ANOVA coupled with multiple comparisons (k, m).

