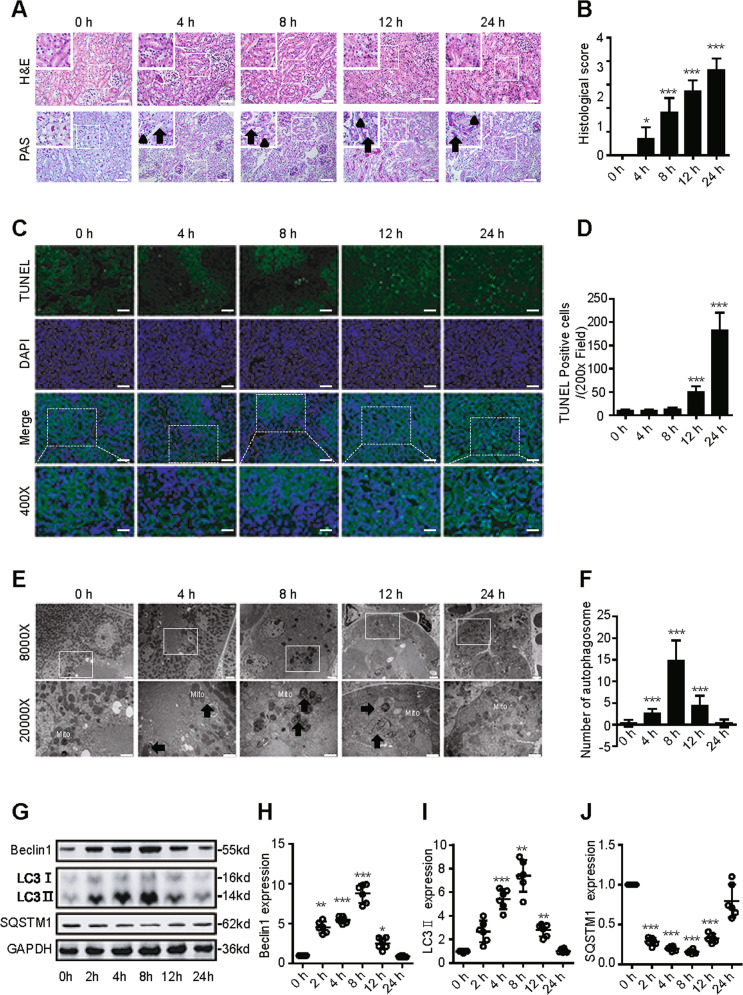
Fig. 1. Dynamic changes in autophagy in an animal model of SAKI.
A Pathological observation of the kidney cortex after H&E staining (upper panel) and PAS staining (lower panel). The irregular brush border (arrow) and ectasia of affected tubules (arrowheads) were observed following CLP surgery (upper panel: 200×; inset: 400×; scale bar = 10 μm). B The tubular damage score was evaluated based on pathological observation (n = 10). C Apoptosis was semi-quantitatively analysed by TUNEL-positive cell staining (upper panel: 200×; lower panel: 400×; scale bar = 5 μm). D The number of TUNEL-positive cells (n = 10). E Morphological observation of autophagy in the kidney cortex under an electron microscope (black arrow: autophagosomes; Mito: mitochondrion; upper panel: magnified ×8000 and scale bar = 2 μm; lower panel: magnified ×20000 and scale bar = 1 μm). F The number of autophagosomes in renal epithelial cells was calculated in 20 randomly selected fields (n = 20). G–J Representative western blot with densitometric analysis of Beclin1, LC3 II and SQSTM1 protein expression (n = 6). The data are presented as the mean ± SD. *p < 0.05, **p < 0.01 and ***p < 0.001 vs the 0-h group. SAKI sepsis-induced acute kidney injury, CLP caecal ligation and puncture, PAS periodic acid–Schiff staining, H&E haematoxylin–eosin staining, TUNEL terminal deoxynucleotidyl transferase dUTP nick end labelling staining, GAPDH glyceraldehyde 3-phosphate dehydrogenase.

