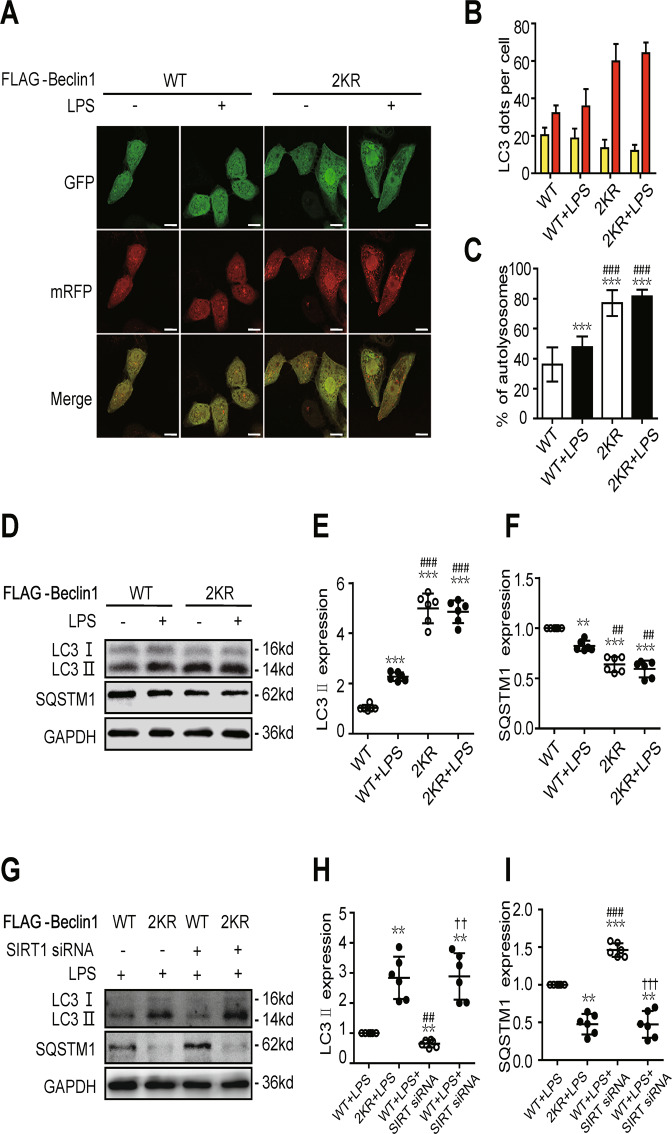
Fig. 6. SIRT1 activates autophagy via the deacetylation of Beclin1.
A In autophagic flux determination and analysis, HK-2 cells were infected with an adenovirus expressing mRFP-GFP-LC3 (magnification ×630 and scale bar = 20 μm). B Mean numbers of autophagosomes (yellow dots per cell in merged images) and autolysosomes (red dots per cell in merged images) were calculated in 20 randomly selected cells (n = 20). C The percentage of autolysosomes (free red spots/(yellow spots + free red spots) per cell) was calculated in 20 randomly selected cells to determine autophagic flux (n = 20). The data are presented as the mean ± SD. ***p < 0.001 vs WT Beclin1 over-expression control (WT group); ###p < 0.001 vs the WT + LPS group. D–F Representative western blots and densitometric analysis of the autophagy-related proteins Beclin1, LC3 II and SQSTM1 (n = 6). The data are presented as the mean ± SD. **p < 0.01 and ***p < 0.001 vs the WT group; ##p < 0.01 and ###p < 0.001 vs the WT + LPS group. G–I Representative western blots of the autophagy-related proteins (LC3 II and SQSTM1) after SIRT1 knockdown or double mutation of Beclin1 (n = 6). The data are presented as the mean ± SD. **p < 0.01 vs the WT + LPS group; ##p < 0.01 and ###p < 0.001 vs the 2KR + LPS group; ††p < 0.01 and †††p < 0.001 vs the WT + LPS + SIRT1 siRNA group. SAKI sepsis-induced acute kidney injury, LPS lipopolysaccharide, SIRT1 silent mating-type information regulation 2 homologue-1, SQSTM1 sequestosome 1, GAPDH glyceraldehyde 3-phosphate dehydrogenase.

