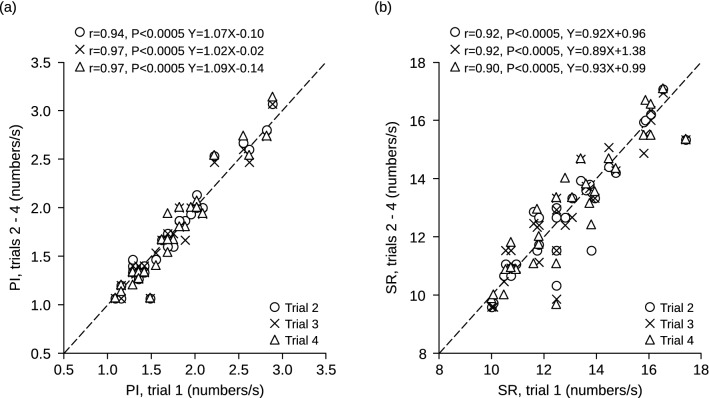
Figure 2.
Stability of performance in different experimental sessions. The Performance Index (a) and the Scanning Rate (b) have been recorded in four different experimental sessions (trials). Values relative to the second, third and fourth trial have been plotted as a function of the initial value. The corresponding coefficients of correlation and regression lines equations have been reported in both A and B. Dotted lines represent equal values on X and Y axes.

