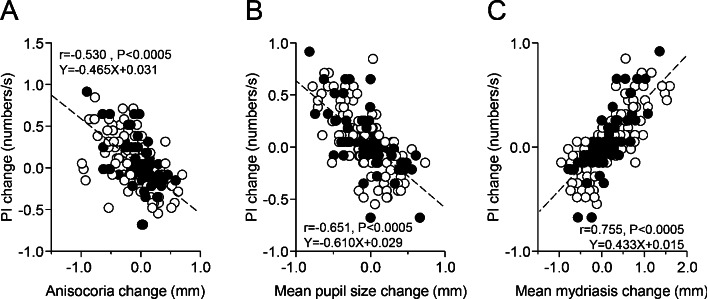
Figure 6.
Relation between the changes in PI and those in average pupil size at rest, task-related mydriasis and anisocoria induced by modifying arches position and occlusal condition. Values of PI changes have been plotted as a function of the corresponding changes in average pupil size (A), anisocoria (B) and task-related mydriasis (C). The dotted lines represent regression lines of all the plotted points, whose equations have been reported in the graphs. Dots and circles refer to TMJ disorders/edentulous and normal subjects, respectively.

