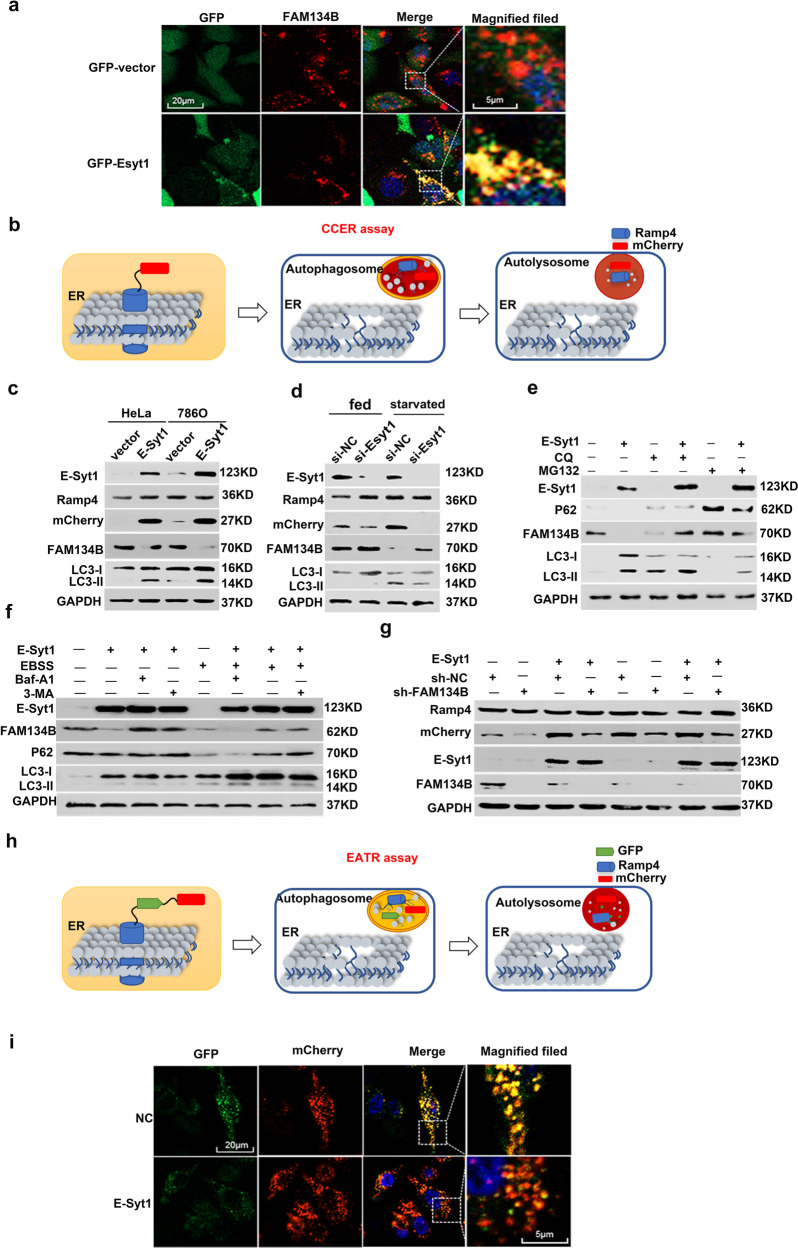
Fig. 4. TFE3 can stimulate ER-phagy by promoting the expression of E-Syt1.
a Confocal images of puncta formed by Esyt1-GFP and FAM134B-mCherry colocalized in 786 O/OE-SR cells. Scale bar 20 µm and 5 µm. b Diagram of CCER assay. When ER-phagy occurs, the lysozyme cleaved the link between mCherry and RAMP4, and mCherry became a small molecule with only 27 KDa which been detected by WB. c HeLa and 786 O/OE-SR cells stably expressing CCER system were transfected with E-Syt1 and Western blot tested ER-phagy degree. d 786 O/OE-SR cells were transfected with sh-Esyt1 plasmid or empty plasmid and starved for 12 h by EBSS before WB measurement. e Western blotting of 786 O/OE-SR cells transfected with Esyt1 and treated with MG132 (10 μM) or CQ (10 mM) for 12 h before harvest. f 786 O/OE-SR cells transfected with E-Syt1 were either in normal condition or in EBSS with or without 3-MA (500 nM), Baf -A1 (100 nM) for 12 h and harvested for WB. g 786 O/OE-SR cells were transfected with E-Syt1 and sh-FAM134B or one of the plasmids. Then cells were cultured in normal condition or in EBSS for 12 h. The result was shown by WB. h Schematic diagram of the EATR assay. When ER-phagy occurs, green fluorescence quenched in acid lysosome leaving only the red fluorescence excited by mCherry. i Confocal images of 786 O/OE-SR cells (stabling expressing EATR system) transfected with E-Syt1 fixed to visualize ER-phagy. Scale bar 20 µm and 5 µm.

