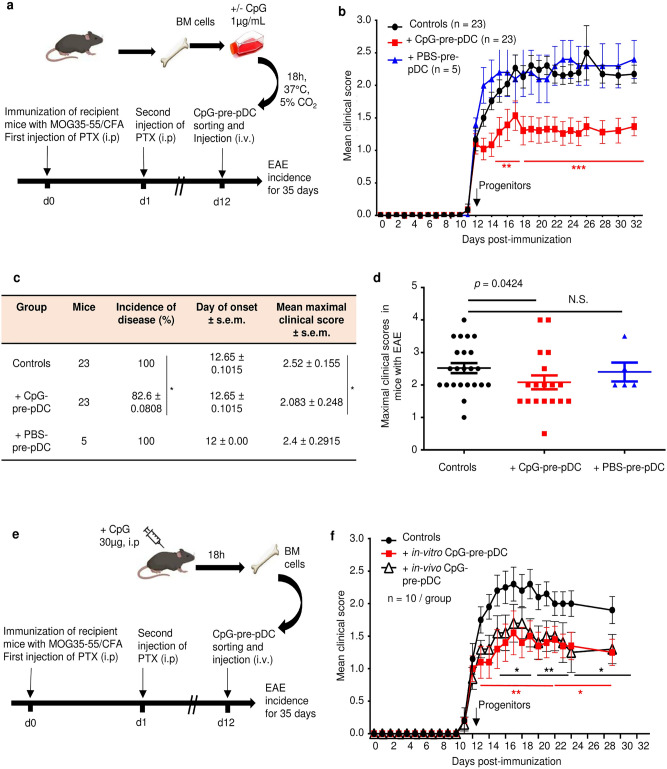
Figure 2.
EAE disease protection by pDC progenitors. c-kit+Sca-1+B220intPDCA-1+ cells were cell-sorted as in Fig. 1a from (a) BM cells stimulated in vitro for 18 h with CpG-B (1 µg/ml) or PBS, and 80,000 cells injected iv into MOG35–55-immunized mice at the onset of EAE clinical signs (d-12). Controls are mice immunized for EAE but injected with PBS medium only. (b) EAE clinical scores (mean ± s.e.m.) were measured over 35 days for MOG35-55 immunized C57Bl/6 J mice and injected with CpG-pre-pDCs (n = 23 mice per group) or PBS-pre-pDCs (n = 5 mice) or PBS (controls, n = 23 mice), data obtained from three cumulated experiments. Statistical analysis was performed using two-way ANOVA with Bonferroni post-test, d14–d17, **, p < 0.004, d18–d30 ****, p = 0.0003 when comparing CpG-pre-pDC injected mice with controls (c, d) Incidence of disease, and mean clinical scores in mice with EAE, but not day of onset were significantly modified by CpG-pre-pDCs but not by PBS-pre-pDCs, *, p = 0.0458, for incidence of disease, by Log-rank test and *, p = 0.0424, for maximal clinical score between controls vs CpG-pre-pDC recipients, by Mann–Whitney test. (e, f) BM cells isolated from mice 18 h after in vivo injection of CpG-B (30 μg/mouse, i.p.) were compared with in vitro-induced CpG-pre-pDCs for their effect on EAE upon injection at d-12 (n = 10 mice/group). Two cumulated experiments. Statistical analysis was performed using two-way ANOVA with Bonferroni post-test, Controls vs in vitro prepared CpG-pre-pDCs: d13–d21 **, p < 0.004, d23–d29 *, p = 0.0177; Controls vs in vivo prepared CpG-pre-pDCs: d14–d17 *, p < 0.032, d19–d21**, p < 0.0018, d23–d29, *, p < 0.047. Mice in (a) and (e) were created with Biorender.com.

