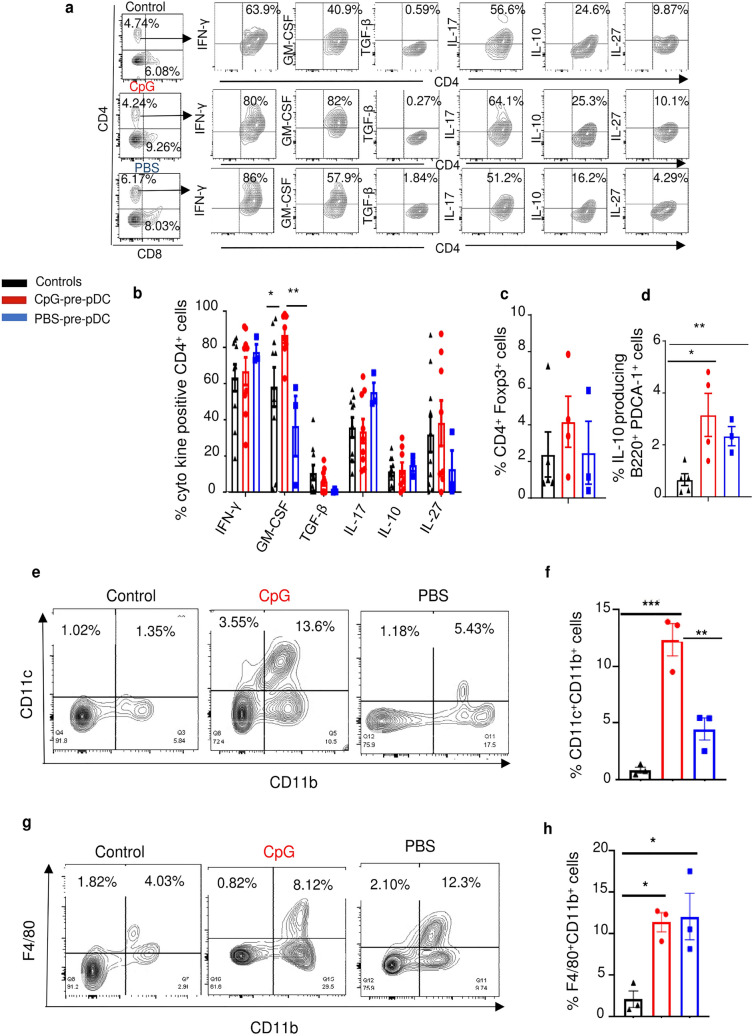
Figure 4.
Analysis of host cells in the spinal cord. Cells recovered from the spinal cord of mice immunized for EAE, either controls injected with PBS medium but no progenitors or injected with CpG- or PBS-pre-pDCs were analyzed at d-18 for their intracytoplasmic expression of cytokines after 4 h activation with PMA/ionomycin in presence of brefeldin using isotype controls. (a) Representative FACS profiles of CD4+ T-cells. (b) Histogram summary of percentages of cytokine-expressing CD4+ T-cells in controls (n = 9) and in CpG-pre-pDC (n = 9) and PBS-pre-pDC (n = 3) recipients. Data from two cumulated experiments are expressed as mean ± s.e.m.. Statistical analysis was performed using unpaired Student’s t-test: GM-CSF: Controls vs + CpG-pre-pDCs, *, p = 0.0395, + PBS-pre-pDCs vs + CpG-pre-pDCs, **, p = 0.0020. Percentages of (c) Tregs (CD4+ Foxp3+ cells) (NS) and of (d) IL-10+ B cells (B220+PDCA-1− cells) were analyzed in the spinal cord of control mice with EAE injected with PBS (n = 5), and in CpG-pre-pDC (n = 5) and PBS-pre-pDC (n = 3) recipients. Mean ± s.e.m. Statistical analysis using one-way ANOVA with Tukey’s post-test indicated significant differences with *, p = 0.0166, **, p = 0.0034. (e–h) Myeloid cells were analyzed. Results shown are representative FACS profiles (e) and summary histograms (mean ± s.e.m.) of percentages of CD11c+CD11b+ cells (f) and F4/80+CD11b+ macrophages (g, h), (e–h) *, p = 0.028,**, p = 0.0035,***, p = 0.0005, analyzed by one-way ANOVA with Tukey’s post-test.

