Figure 5.
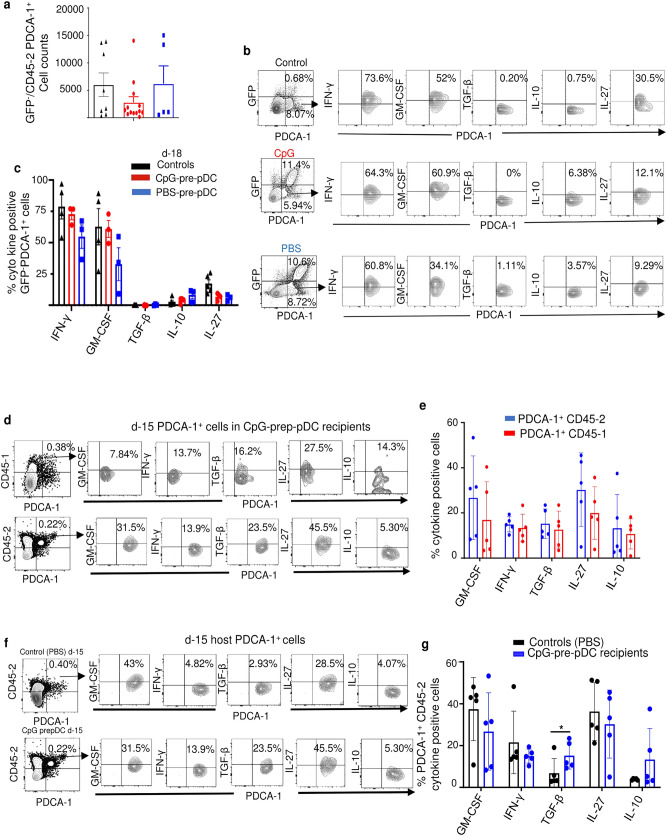
Quantitative and qualitative assessment of PDCA-1+ cells in the spinal cord. (a) Flow cytometry analysis of host GFP−/CD45.2 PDCA-1+ cell counts at d-18 in the spinal cord of control mice with EAE injected with PBS (n = 8) relative to those in CpG-pre-pDC (n = 13) and PBS-pre-pDC (n = 5) recipients. Data from two cumulated experiments. No significant differences were found using one-way ANOVA with Bonferroni post-test. (b, c) Cytokine expression measured using isotype controls, after 4 h activation with PMA/ionomycin in presence of brefeldin, by host GFP−PDCA-1+ cells at d-18 in the spinal cord of the same three groups of mice (n = 4 controls, n = 3 CpG-pre-pDC recipients and n = 3 PBS-pre-pDC recipients). Shown are representative FACS profiles (b) and histograms of percentages expressed as mean ± s.e.m. (c) No significant statistical differences were found using one-way ANOVA with Bonferroni post-test. (d, e) Compared cytokine expression analysis at d-15 in CD45.1 progenitor-derived and CD45.2 host-derived PDCA-1+ cells of the spinal cord of CpG-pre-pDC recipients. Shown are representative FACS profiles (d) and histograms of percentages (e) expressed as mean ± s.e.m. (n = 5 mice/group). No significant differences using Students’ t-test. (f, g) Compared cytokine expression analysis at d-15 in host CD45.2 PDCA-1+ cells in control mice with EAE injected with PBS and in CpG-pre-pDC recipients. Shown are representative FACS profiles (f) and histograms of percentages (g) expressed as mean ± s.e.m. (n = 5 mice). Statistical analysis using Students’ t-test, *, p = 0.0291.

