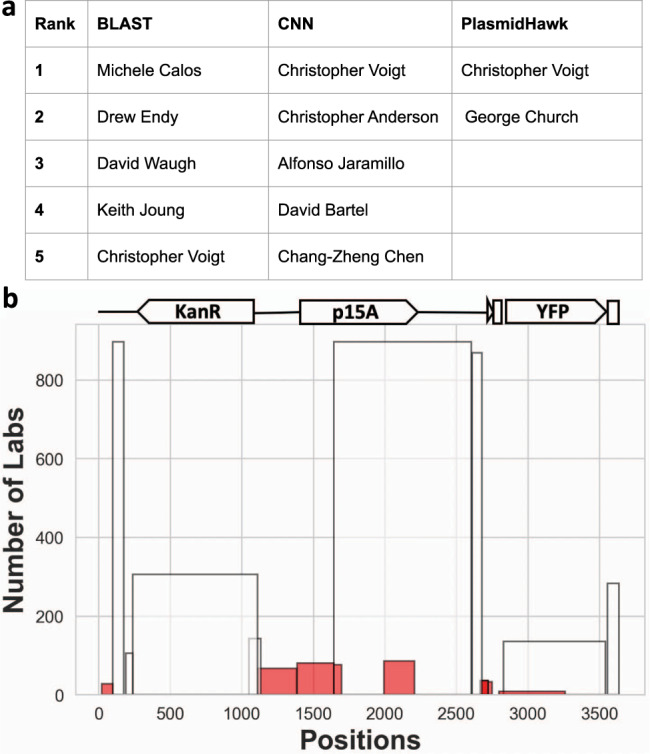
Fig. 3. BLAST, CNN, and PlasmidHawk prediction comparisons and interpretation.

a BLAST, CNN, and PlasmidHawk lab-of-origin prediction results. b The number of labs annotated for the regions of pCI-YFP that aligned to different fragments in the synthetic pan-genome. Each bar represents a fragment aligning to the positions in pCI-YFP. The height of the bar represents the number of labs annotated with that fragment. Pan-genome fragments with <100 labs annotated with have aligned to pCI-YFP at 21–98nt, 1110–1697nt, 1993–2209nt, 2667–2751nt and 2797–3260nt positions (red bars). For clarity, the figure only displays a subset of the aligned fragments. The complete set of aligned fragments are shown in Supplementary Fig. 6.
