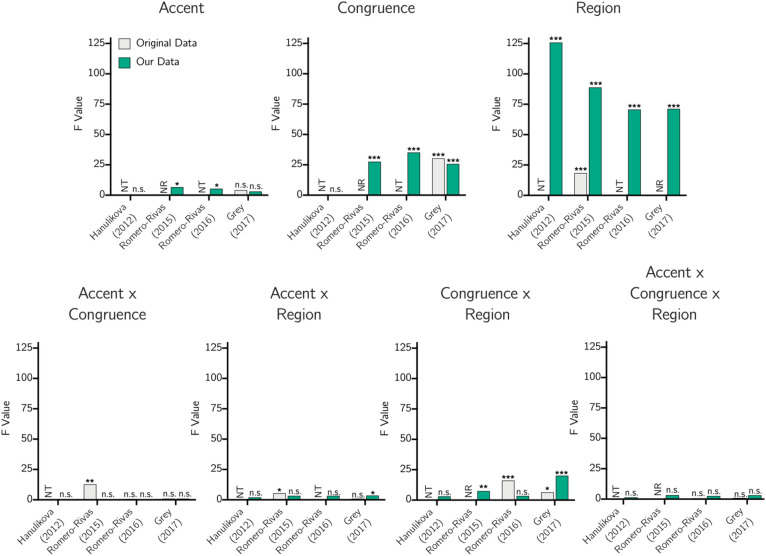
Figure 4.
A graphical representation of F values for each main effect and interaction in the P600 time range found using each parameter set, either as reported in the original study (“original data”) or using our data (“our data”). Note: Stars indicate significance (*p < 0.05, **p < 0.01, ***p < 0.001), “n.s.” indicates not significant at p < 0.05, “NR” indicates the main effect or interaction was tested in the original study but a significant result or F value was not reported, and “NT” indicates testing of the main effect or interaction was not conducted in the original study in a way comparable with our approach.

