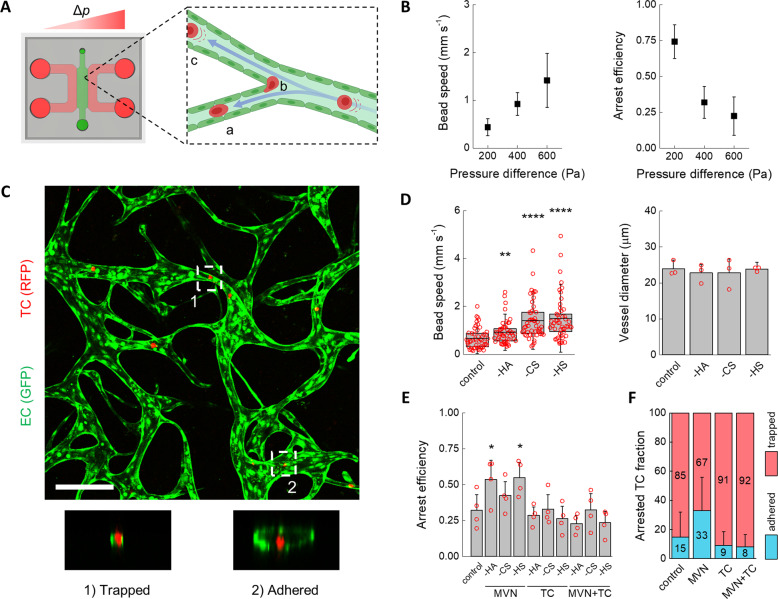
Fig. 2. Characterization of TC arrest under flow in the MVNs.
A Schematic diagram of the microfluidic device used to perfuse MVNs under a constant pressure difference Δp and cells being carried by luminal flow into A narrow channels and B impacting the endothelium at bifurcations or C large vessels (partially realized with Biorender.com). B Speed of inert beads carried by luminal flow driven by different pressure differences (n = 50 beads tracked in three devices, average and standard deviation shown) and arrest efficiency of TCs (n = 4 devices, average and standard deviation shown) as a function of the pressure difference. C Confocal image of two arrest mechanisms showing MDA-MB-231 cells within MVNs arrested by (1) physical trapping and (2) adhesion. The scale bar is 200 µm. D Bead speed through the MVNs (n as above, the error bars indicate the standard deviation) and vessel diameter as a function of specific GCX component removal (the error bars indicate the standard deviation between the averages of n = 3 devices, 3 regions of interest each). E Arrest efficiency of TCs as a function of GCX enzymatic treatment of the MVNs alone, TCs alone, or both MVNs and TCs (n = 4 devices). F Cumulative percentage of TCs either physically trapped in small vessels or adhered to large vessels in the MVNs (n > 40 cells). Statistical significance was assessed by student’s t test assuming normally distributed data, p < 0.05 *, p < 0.01 **, p < 0.0001 ****. A normal distribution of the data in (B) and (D) was confirmed by Kolmogorov–Smirnov test.

