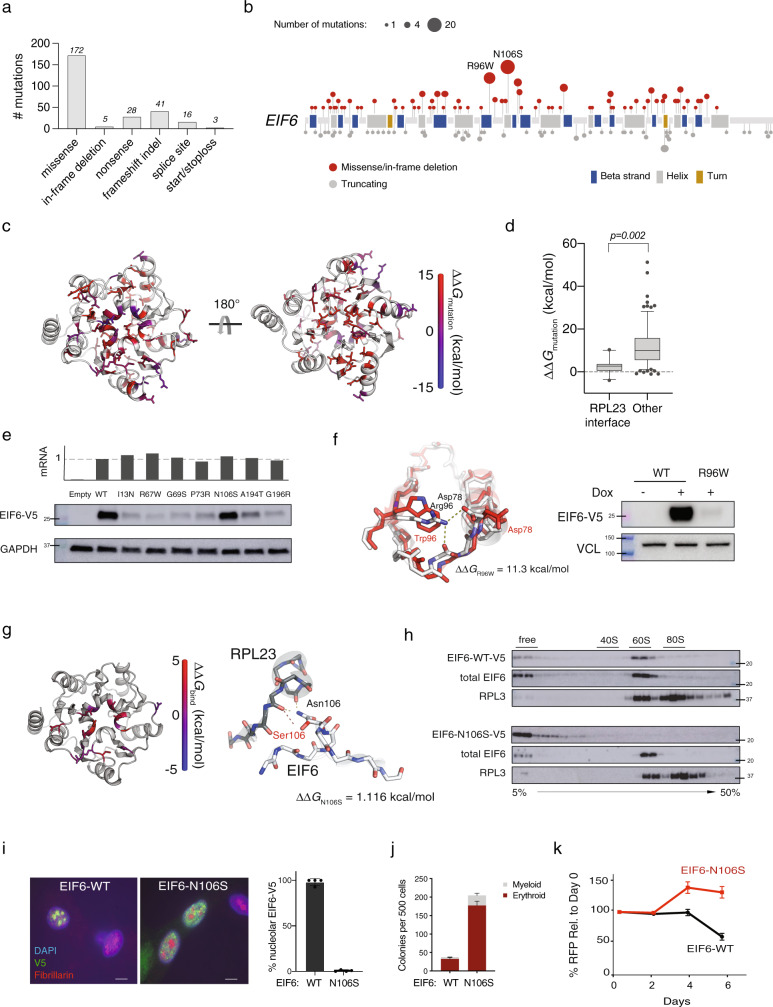
Fig. 2. EIF6 somatic missense mutations alter EIF6 protein stability or function to improve cell fitness.
a Types of somatic EIF6 mutations. b Number and location of EIF6 mutations according to variant type. c Impact on the calculated energy of the folded state (ΔΔGmutation) of EIF6 missense mutations. Mutant residue colored according to ΔΔG value. d ΔΔGmutation of 12 EIF6 missense mutations located at the RPL23-binding interface versus 85 other EIF6 missense mutations located in the remainder of EIF6. Boxes center around the median and span the 25th and 75th percentiles, whiskers extend to the 10th and 90th percentiles. p value calculated using unpaired two tailed t-test. e Relative levels of EIF6 mRNA using a V5-specific qPCR primer (top panel) and V5 immunoblot from K562 cells 48 h after doxycycline treatment (bottom panel). Data shown is representative of three independent experiments. f Left panel: In silico modeling of EIF6-R96W. Right panel: V5 and VCL immunoblots of K562 cells with inducible EIF6-R96W versus V5-wild type EIF6 48 h after doxycycline treatment. Data shown is representative of three independent experiments. g Left panel: Change in the energy of binding (ΔΔGbind) of missense mutations at RPL23 interface. Mutant residues are colored according to ΔΔGbind. Right panel: In silico modeling of EIF6 N106S mutation. h V5, EIF6, and RPL3 immunoblots of sucrose gradient fractions from polysome profiles of doxycycline-treated K562 cells expressing V5-EIF6-WT or V5-EIF6-N106S. Data shown is representative of three independent experiments. i Immunofluorescence of V5-EIF-WT or V5-N106S-EIF6 protein in SDS patient-derived fibroblasts, V5 (green), fibrillarin (red), and DAPI (blue). Right panel: quantification of V5 nucleolar signal from four independent experiments. Error bars represent the mean ± standard deviation. Scale bar = 10 μm. j Quantification of colony forming units from sorted CD34+ transduced with shSBDS-GFP and either EIF6-WT-RFP or EIF6-N106S-RFP plated in triplicate. Data shown are representative of three independent experiments. Error bars represent the mean ± standard deviation. k Competitive growth of doxycycline inducible-shSBDS in K562 cells (Supplementary Fig. 3D) transduced with either EIF6-WT-RFP or EIF6-N106S-RFP after indicated time from doxycycline treatment (n = 3 technical replicates, representative of three biological replicates). Error bars represent mean ± standard deviation.

