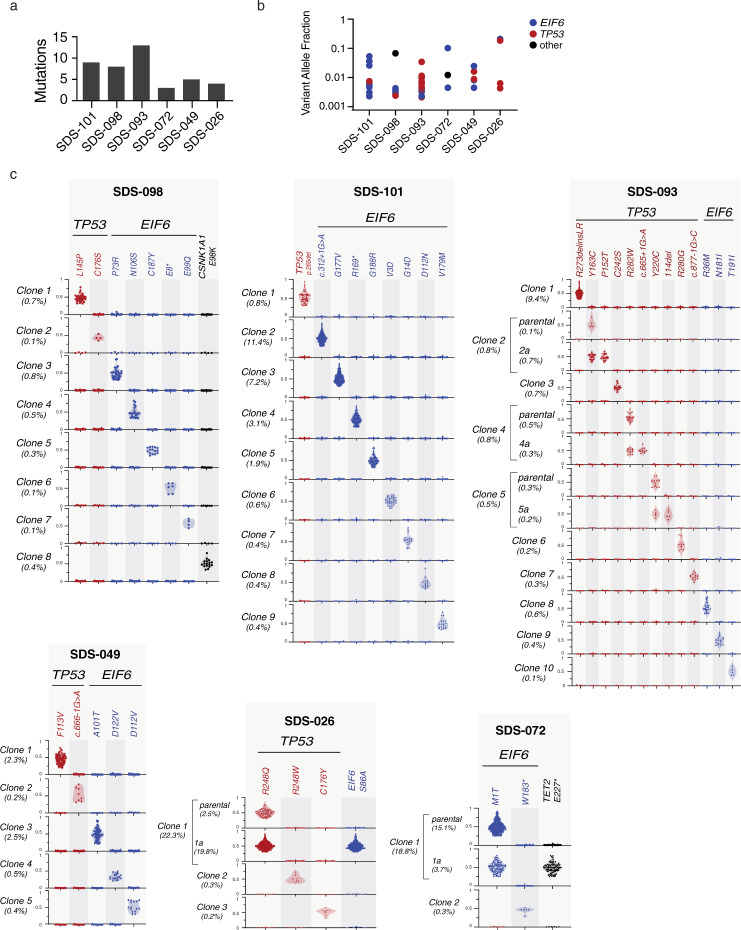
Fig. 4. Independence of TP53 and EIF6 mutated clones in SDS patients.
a Number of somatic mutations detected in each patient by bulk DNA sequencing. b corresponding VAF of TP53 (red), EIF6 (blue) or other (black) mutation. c Clonal hierarchy of mutations determined by single cell sequencing amongst six patients with SDS. Each row represents a unique clone or subclone and the frequency of each clone is indicated to the left. Columns reflect the genotype status of each mutation in each clone, and all depicted clones have complete genotyping at all loci. The y-axis indicates single cell VAF from 0 to 1, where 0 is absent, 0.5 is heterozygous mutation, and 1 is homo/hemizygous. Each dot reflects a single cell, colored according to gene mutation, TP53 (red), EIF6 (blue), CSNK1A1 (black) and the frequency distribution of the data points reflected by shaded violin plots.

