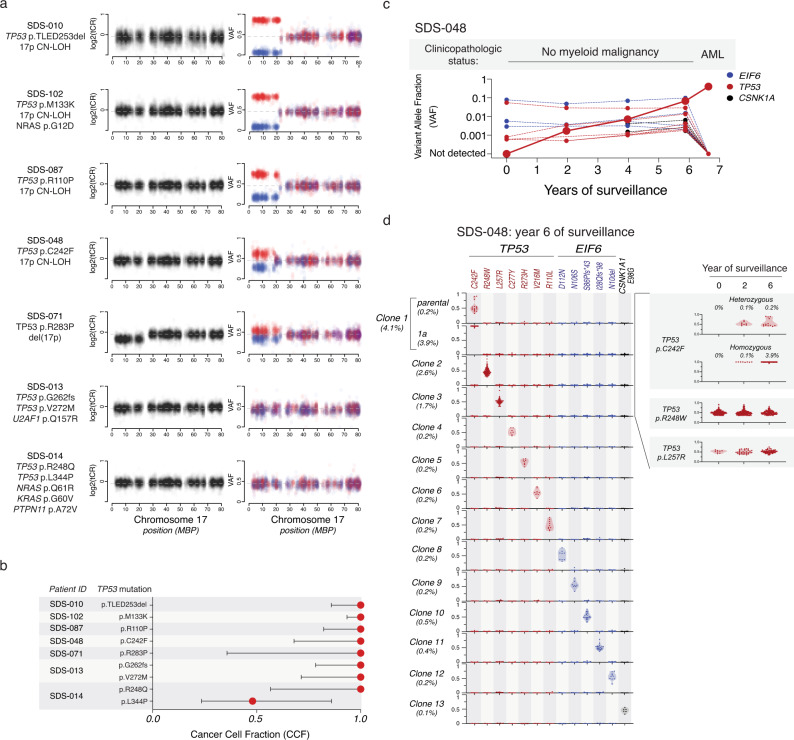
Fig. 6. Biallelic TP53 inactivation and myeloid neoplasia in patients with SDS.
a Total copy ratio (tCR, denoted in black) and phased SNP-VAF (denoted in red/blue) across chromosome 17. b Cancer cell fraction of somatic TP53 mutations in seven patient samples analyzed in panel a. c Shown are the clinicopathologic status and VAF of somatic TP53 (red), EIF6 (blue), and CSNK1A (black) mutations from bulk sequencing of serial samples from SDS-048, a patient with SDS who progressed to AML. d Single cell sequencing demonstrating clonal hierarchy from SDS-048 during serial surveillance prior to development of AML. Each row represents a unique clone or subclone and the frequency of each clone is indicated to the left. Columns reflect the genotype status of each mutation in each clone, and all depicted clones have complete genotyping at all loci. Y-axis indicates single cell VAF from 0 to 1, where 0 is absent, 0.5 is heterozygous mutation, and 1 is homo/hemizygous. Each dot reflects a single cell, colored according to gene mutation, TP53 (red), EIF6 (blue), CSNK1A1 (black) and the frequency distribution of the data points reflected by shaded violin plots. Shown on the right is a time course indicating dynamics of the pre-leukemic p.C242F mutated clone and two independent TP53-mutated clones that did not transform.

