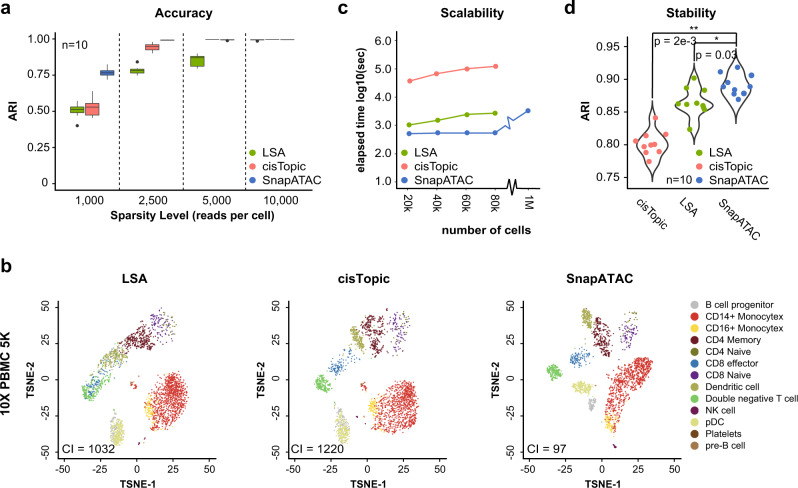
Fig. 4. SnapATAC outperforms current methods in accuracy, sensitivity, scalability, and stability of identifying cell types in complex tissues.
a A set of simulated datasets are generated with varying coverage ranging from 1000 to 10,000 reads per cell cells (Methods section). For each coverage, n = 10 random replicates are simulated, and clustering accuracy measurement is based on Adjusted Rank Index (ARI). Data are presented as median values ± 25% percentile. b T-SNE representation of PBMC single-cell ATAC-seq profiles analyzed by three methods. The cell-type identification was predicted by 10X PBMC single-cell RNA-seq (CI = connectivity index; Methods section). c A mouse dataset8 (data source listed in Supplementary Table 1) is sampled to different number of cells ranging from 20k to 1 M. For each sampling, we compared the CPU running time of different methods for dimensionality reduction. d A set of perturbations (n = 5) are introduced to the mouse atlas dataset by down sampling to 90% of the original sequencing depth. Clustering outcomes are compared between different downsampled datasets (n = 10) to estimate the reproducibility. One-tailed t-test was performed to estimate the significance level between SnapATAC and each of the other methods (*p < 0.05 and **p < 0.01).

