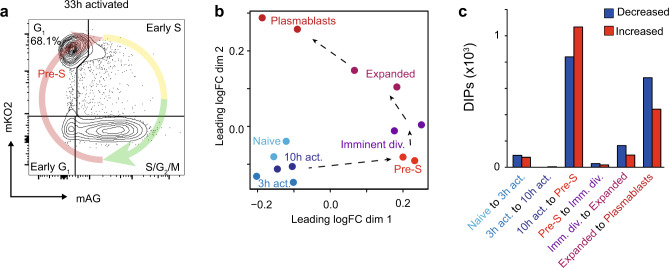
Fig. 5. Genome organizational changes occur prior to DNA synthesis.
a Flow cytometry plot of G1 stage FUCCI B cells that were flow cytometry purified by monomeric Kusabira Orange 2 (mKO2) and monomeric Azami Green (mAG) expression just prior to the first division (33 h). b Multidimensional-scaling plot of the filtered and normalized logCPM values for interacting promoters during B-cell activation with Pre-S samples included. c Bar plot showing the number of differentially interacting promoters (DIPs) between each transition of B-cell activation with Pre-S samples included. Blue indicates decreased promoter interactions. Red indicates increased promoter interactions. Source data are provided as a Source Data file.

