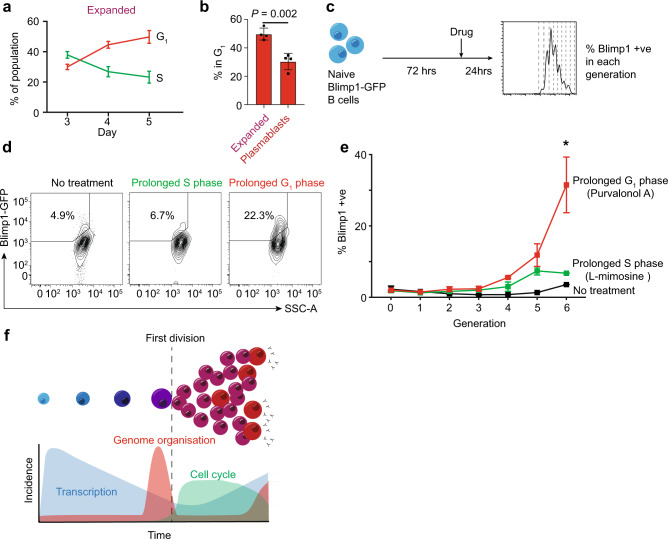
Fig. 6. Major genome organizational change transitions associate with prolonged time in G1 phase.
a The percentage of the expanded B-cell population in the G1 or S phase of the cell cycle, as determined by FUCCI, at days 3, 4, and 5 of culture. Mean ± standard deviation from 4 independent experiments is shown. b The percentage of the expanded and plasmablast population in the G1 phase of the cell cycle, as determined by FUCCI, at day 5 of culture. The data were using an unpaired two-tailed Student’s t-test with Welch’s correction. Mean ± standard deviation from 4 experiments is shown. c Schematic of the experimental set-up for cell cycle manipulations. d Flow cytometry plots showing Blimp-GFP B cells cultured with l-mimosine (prolonged S phase), Purvalonal A (prolonged G1 phase) for 24 h or no treatment. Gate and percentage show the percentage of differentiated plasmablasts (Blimp+ve) within generation 6 of the culture. e Percentage of plasmablasts (Blimp+ve) within each generation of the Blimp-GFP B-cell 4-day cultures when treated with Purvalonal A (prolonged G1 phase), l-mimosine (prolonged S phase), or no treatment. The data were analyzed using a two-way ANOVA. Mean ± SD from 4 experiments is shown. f Model of relationship between transcription, genome organization, and cell cycle. Source data are provided as a Source Data file.

