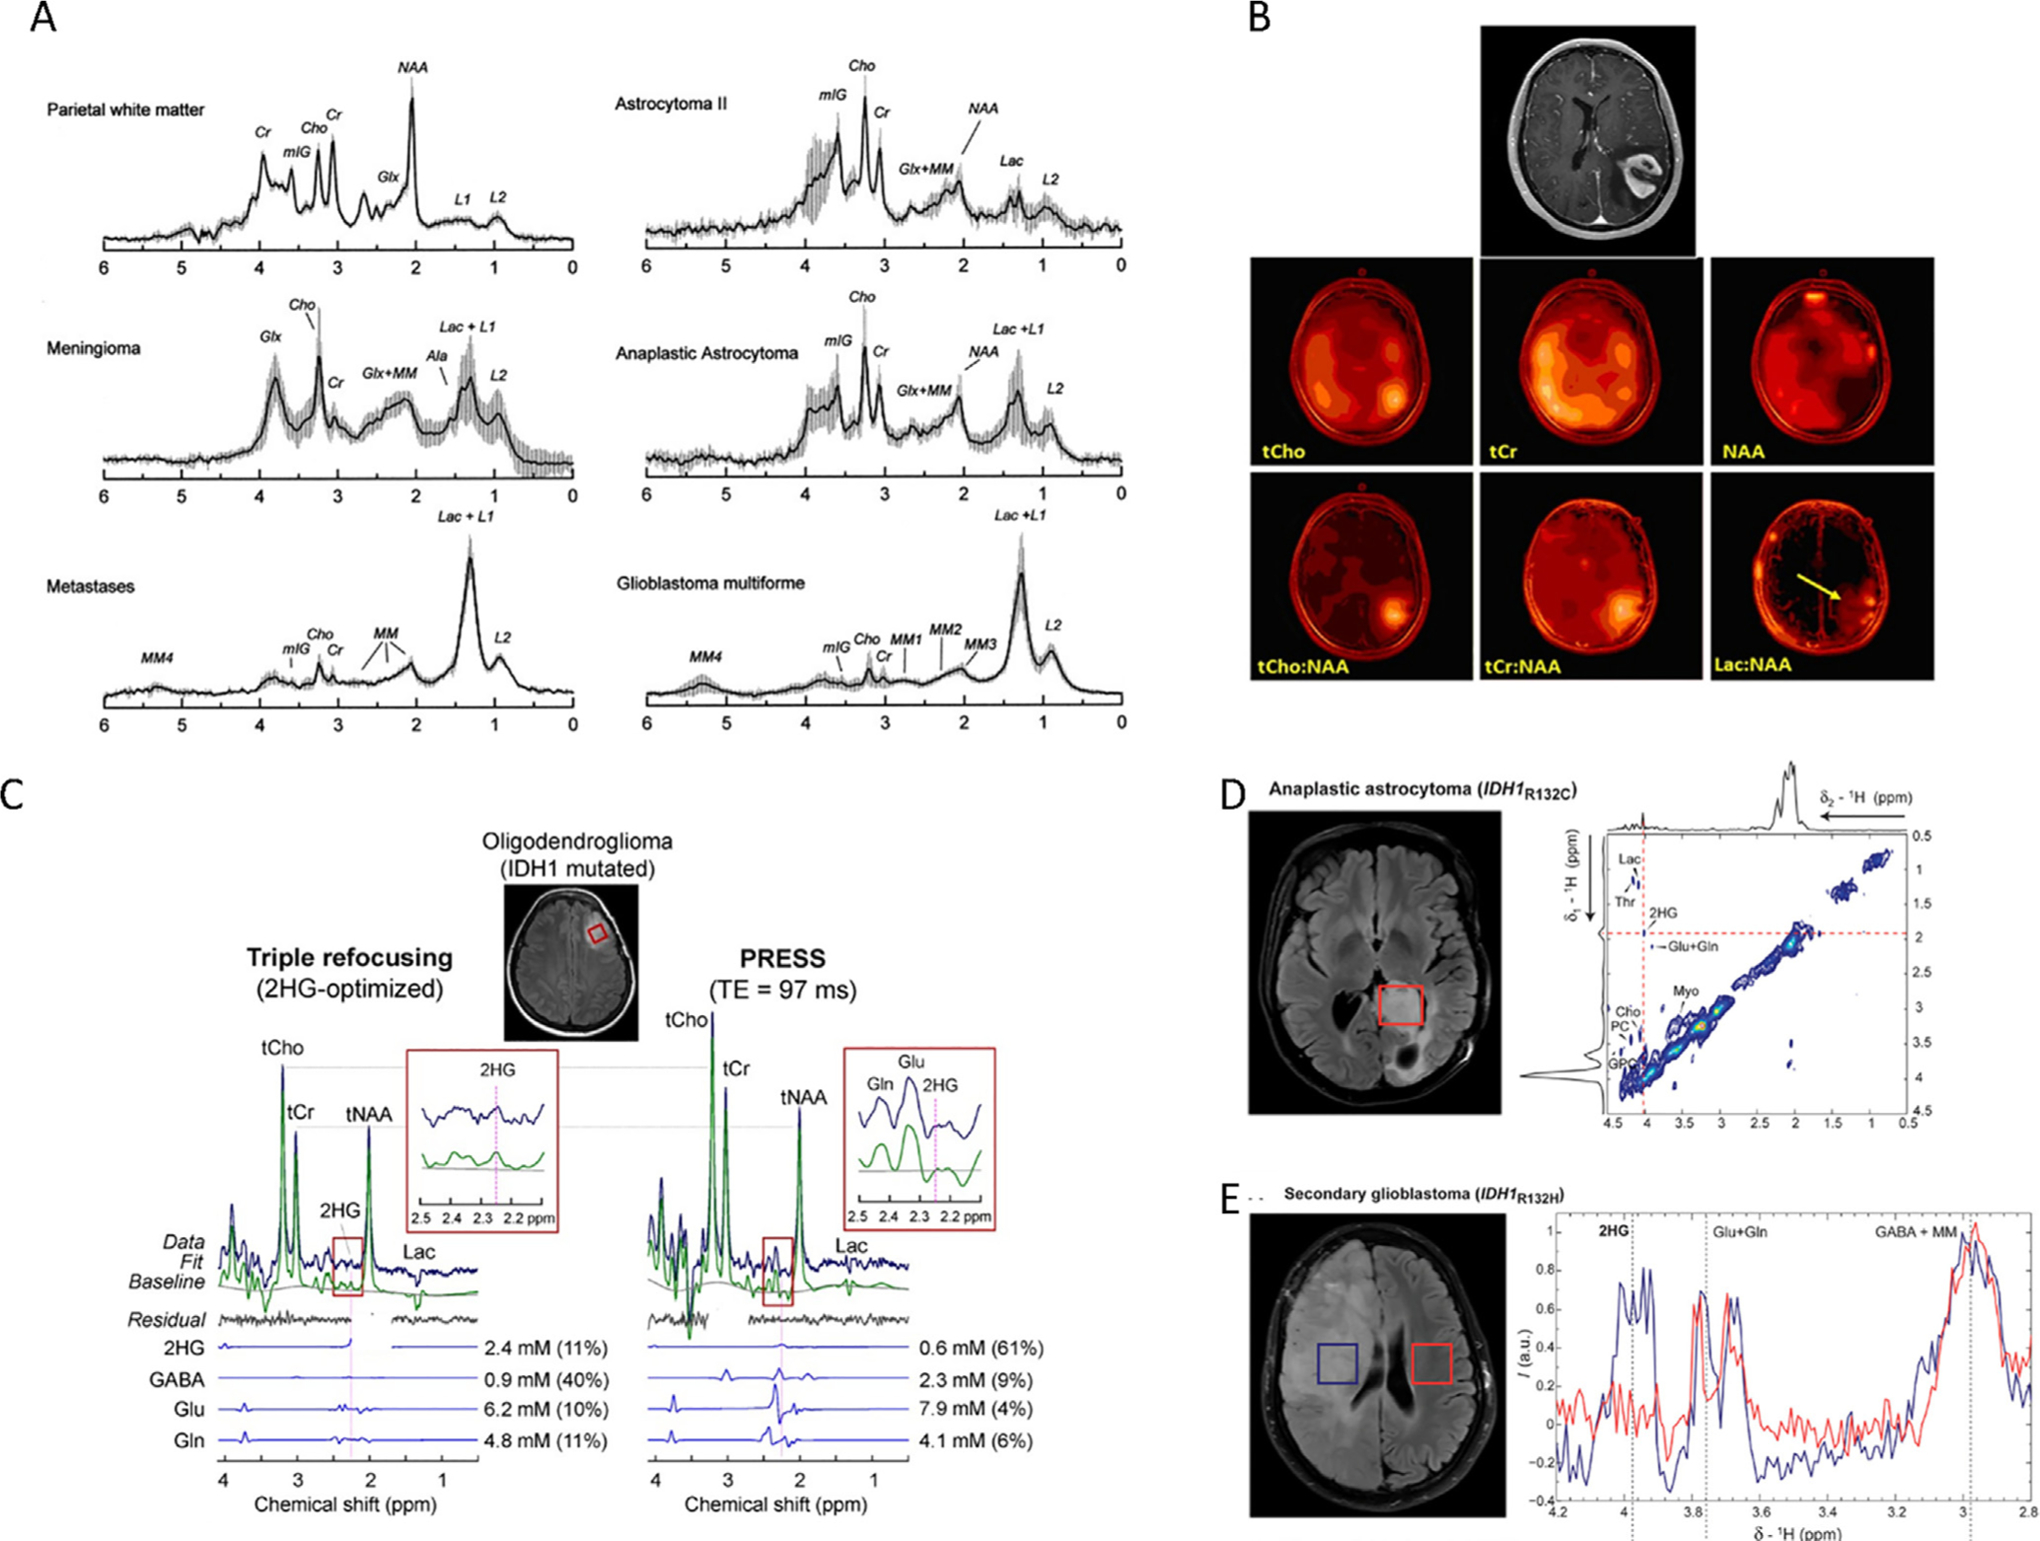
Fig. 3.

Metabolic characterization of brain tumors by in vivo MRS. A, Mean and SD (vertical lines) of normalized STEAM (TE = 30 ms) spectra for normal white matter (n = 6), meningioma (n = 8), metastases (n = 6), astrocytoma grade II (n = 5), anaplastic astrocytoma (n = 7) and glioblastoma (n = 13). Reproduced with permission from [204]. B, Contrast-enhanced axial MR image demonstrating an enhancing mass in the left parietal lobe (top) and corresponding multivoxel imaging data displayed as color maps displaying the spatial distributions of (left-to-right) total choline (tCho), total creatine (tCr), and N-acetylaspartate (NAA). Figure taken from [205]. C, In vivo spectra from an IDH1-mutated oligodendroglioma, obtained with triple refocusing (left) and PRESS TE = 97 ms (right). LCModel outputs and spectra of 2HG, GABA, Glu, and Gln are also shown. The voxel size and scan time were identical between the scans (2 × 2 × 2 cm3 and 5 min). Spectra were normalized to STEAM TE = 13 ms water. Insets show magnified spectra between 2.1 and 2.5 ppm to highlight 2HG resonance signal. Reproduced with permission from [206]. D, 2D LASER-COSY spectra in vivo of an anaplastic astrocytoma patient with IDH1-R132C at 3 T. The 2D LASER-COSY shows at 4.02/1.91 ppm the Hα-Hβ cross peak of 2HG. Projections along both spectral dimensions through 2HG cross peak indicate the SNR and spectral quality. The single voxel (3 × 3 × 3 cm3, red rectangle) was placed on the FLAIR images to include most of the tumor mass. Reproduced with permission from [207]. E, 1D MEGA-LASER spectra in vivo of a secondary GBM with IDH1-R132H at 3 T. Two voxels (3 × 3 × 3 cm3 each) were placed in both brain hemispheres, symmetrically from the middle line. Reproduced with permission from [207].
