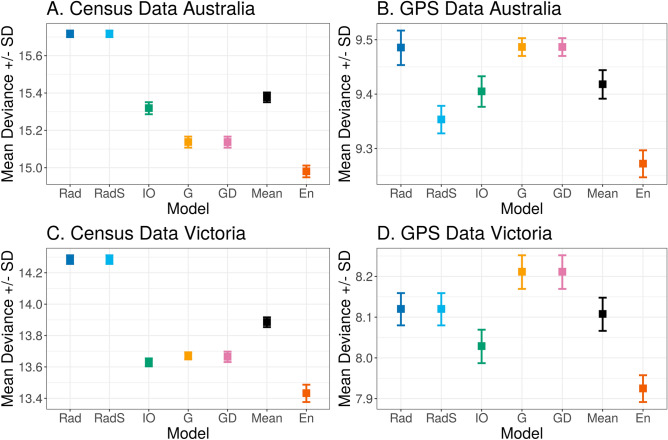
Figure 2.
Comparison of mean deviance between models for each dataset and geographic scale. Legend: G = gravity model; GD = gravity with distance model; Rad = radiation model; RadS = radiation with selection model; IO = intervening opportunities model; En = ensemble model; Mean = mean deviance across all model types. Note the y-axis is on a log scale and the absolute value of the deviance is not comparable between datasets. The deviance is a measure of how well a given model predicts the test data (which was not used to train the models) relative to the other models for a given dataset. The error bars show how the deviance varied for each model type across the 5-folds. This figure was produced using the R33 package ggplot234.

